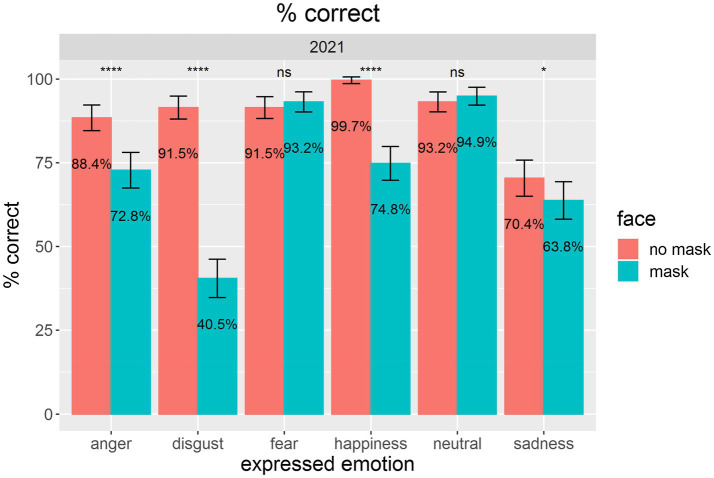
Figure 2.
The figure demonstrates mean performance levels for assessments of emotional states for faces without masks (red) compared with faces with masks (blue). Error bars indicate 95% confidence intervals (CIs) according to Morey (2008). Pairwise comparisons of the presentation conditions were calculated via undirected paired t-tests. *p < 0.05. ****p < 0.0001. Nonsignificant results are marked with ns.

