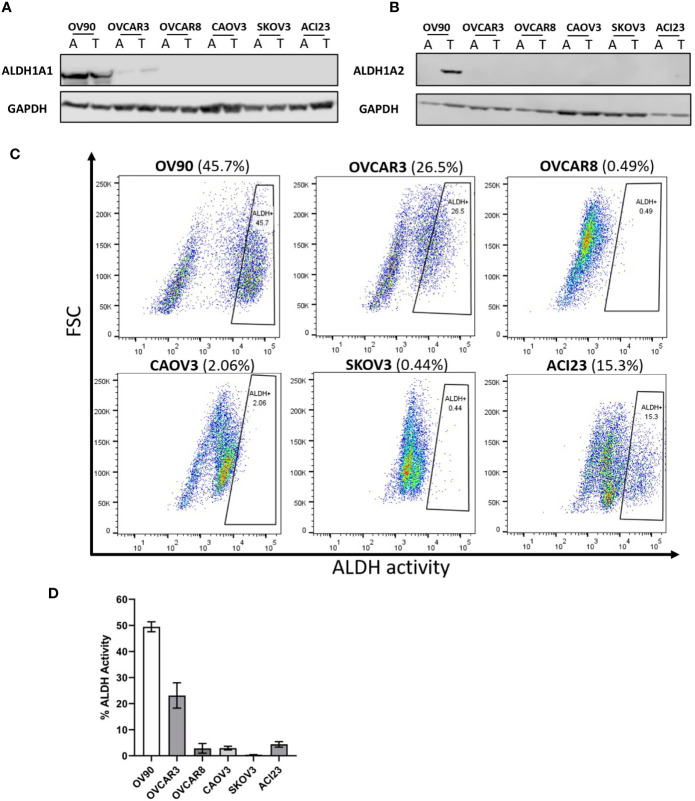
Figure 1.
Detection of ALDH1 isoforms in ovarian cancer cell lines by Western blot analysis, and measurement of ALDH activity in TICs determined by ALDEFLUOR flow cytometry assay. Western blot analysis of lysates probed for the expression of (A) ALDH1A1 and (B) ALDH1A2 in the indicated cell lines in adherent and TIC growth conditions. (C) The ALDH-positive population of TICs in the indicated cells lines detected via flow cytometry after 72 h in TIC growth conditions. (D) Quantified percentages of ALDH activity in cell lines (n = 2). Graphs represent mean and SEM of each indicated cell line. A, adherent cells; T, TICs.

