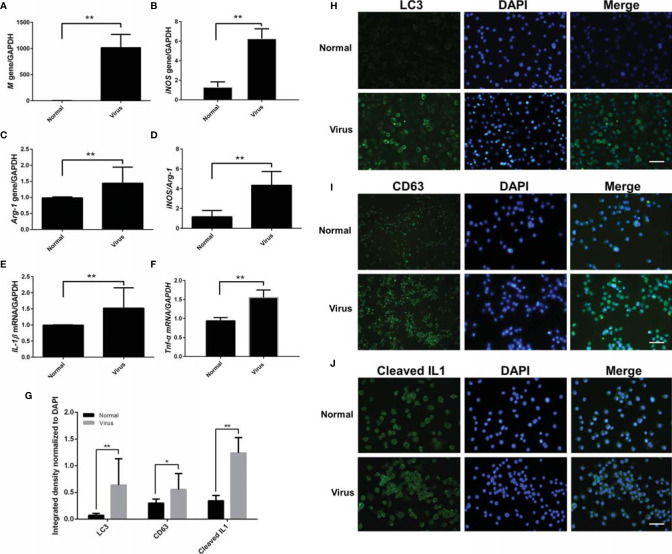
Figure 3.
M1 polarization and LC3/CD63/IL-1β analysis of infected ANA-1 macrophages. Total RNA was isolated from infected ANA-1 cells at 24-h post-infection and used for transcriptional analysis of the related genes. (A) Influenza virus M gene. (B) iNOS gene (M1 marker). (C) Arg-1 gene (M2 marker). (D) iNOS/Arg-1 (M1/M2 bias). (E) IL-1β (a proinflammatory cytokine). (F) Tnf-α (an inflammatory cytokine). N ≥ 3, **p < 0.01. (G–J) Normal and infected ANA-1 cells were fixed, incubated with primary antibodies (LC3/CD63/cleaved IL-1β, 1:1000 dilution), and then fluorescently stained with the secondary antibody (anti-rabbit IgG Fab2 Alexa Fluor ® 488 molecular probes, 1:2000 dilution). (G) The cells’ fluorescence intensity of LC3, CD63, and cleaved IL1-1β was quantified and normalized by the corresponding DAPI fluorescence amount using the Image-Pro Plus 6.0 software. No fewer than three fluorescent images were captured and analyzed for each group. *p < 0.05 and **p < 0.01. (H) LC3 cellular immunofluorescence. (I) CD63 cellular immunofluorescence. (J) Cleaved IL-1β cellular immunofluorescence. Scale bar: 50 μm.

