Figure 6.
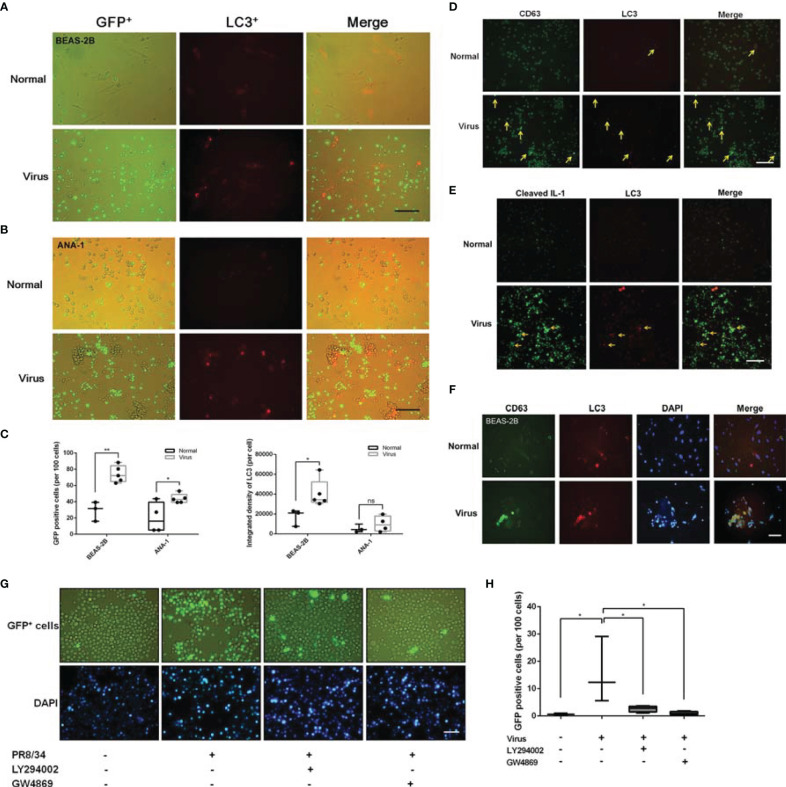
Crosstalk among LC3, CD63, and cleaved IL-1β in macrophage recruitment. (A, B) Transwell assays results showed that LC3 enhanced macrophage recruitment in PR/8/34 infected BEAS-2B cells (A) and ANA-1 cells (B). GFP+ ANA-1 cells were incubated in the upper chambers, BEAS-2B and ANA-1 cells transfected with mRFP-LC3 lentivirus were incubated in the lower chambers and infected with PR/8/34 virus. Scale bar: 100 μm. (C) Cell counting of GFP-positive cells (per 100 cells) and the fluorescent quantitation of LC3 (per cell) using the Image-Pro Plus 6.0 software. No fewer than three fluorescent images were captured and analyzed per group. *p < 0.05 and **p < 0.01. (D, E) LC3, CD63, and IL-1β interaction. The ANA-1 cells transfected with mRFP-LC3 lentivirus were infected with PR/8/34 virus for 24 h. Then, these cells were fixed, permeabilized, blocked, probed with primary antibodies for the detection of CD63 (D), and cleaved IL-1β (E), followed by exposure to the anti-rabbit IgG Fab2 Alexa Fluor ® 488 molecular probes. After staining the cell nuclei with DAPI, the interaction between LC3/CD63/IL-1β was observed and imaged. Scale bar: 100 μm. (F) LC3 and CD63 interaction in the infected BEAS-2B cells. The BEAS-2B cells transfected with mRFP-LC3 lentivirus were infected with PR/8/34 virus for 24 h. The cells were then fixed, permeabilized, blocked, and probed with primary antibodies for the detection of CD63, followed by the anti-rabbit IgG Fab2 Alexa Fluor® 488 molecular probes. After staining the cell nuclei with DAPI, the interaction of LC3/CD63 was observed and imaged. Scale bar: 50 μm. (G) The influence of autophagy and exosome inhibitors on macrophage recruitment. GFP+ ANA-1 cells were incubated in the upper chambers of the transwell system, while ANA-1 cells were incubated in the lower chambers, infected with PR/8/34 virus, and treated with the autophagy inhibitor LY294002 (1 µM) and the exosome inhibitor GW4869 (1 µM). GFP+ ANA-1 macrophages in the lower chambers were counted to evaluate the trans-membrane recruitment of macrophages. Scale bar: 50 μm. (H) Cell counting of GFP-positive cells (per 100 cells). No fewer than three fluorescent images were captured and analyzed per group. *p < 0.05. ns, no significance.

