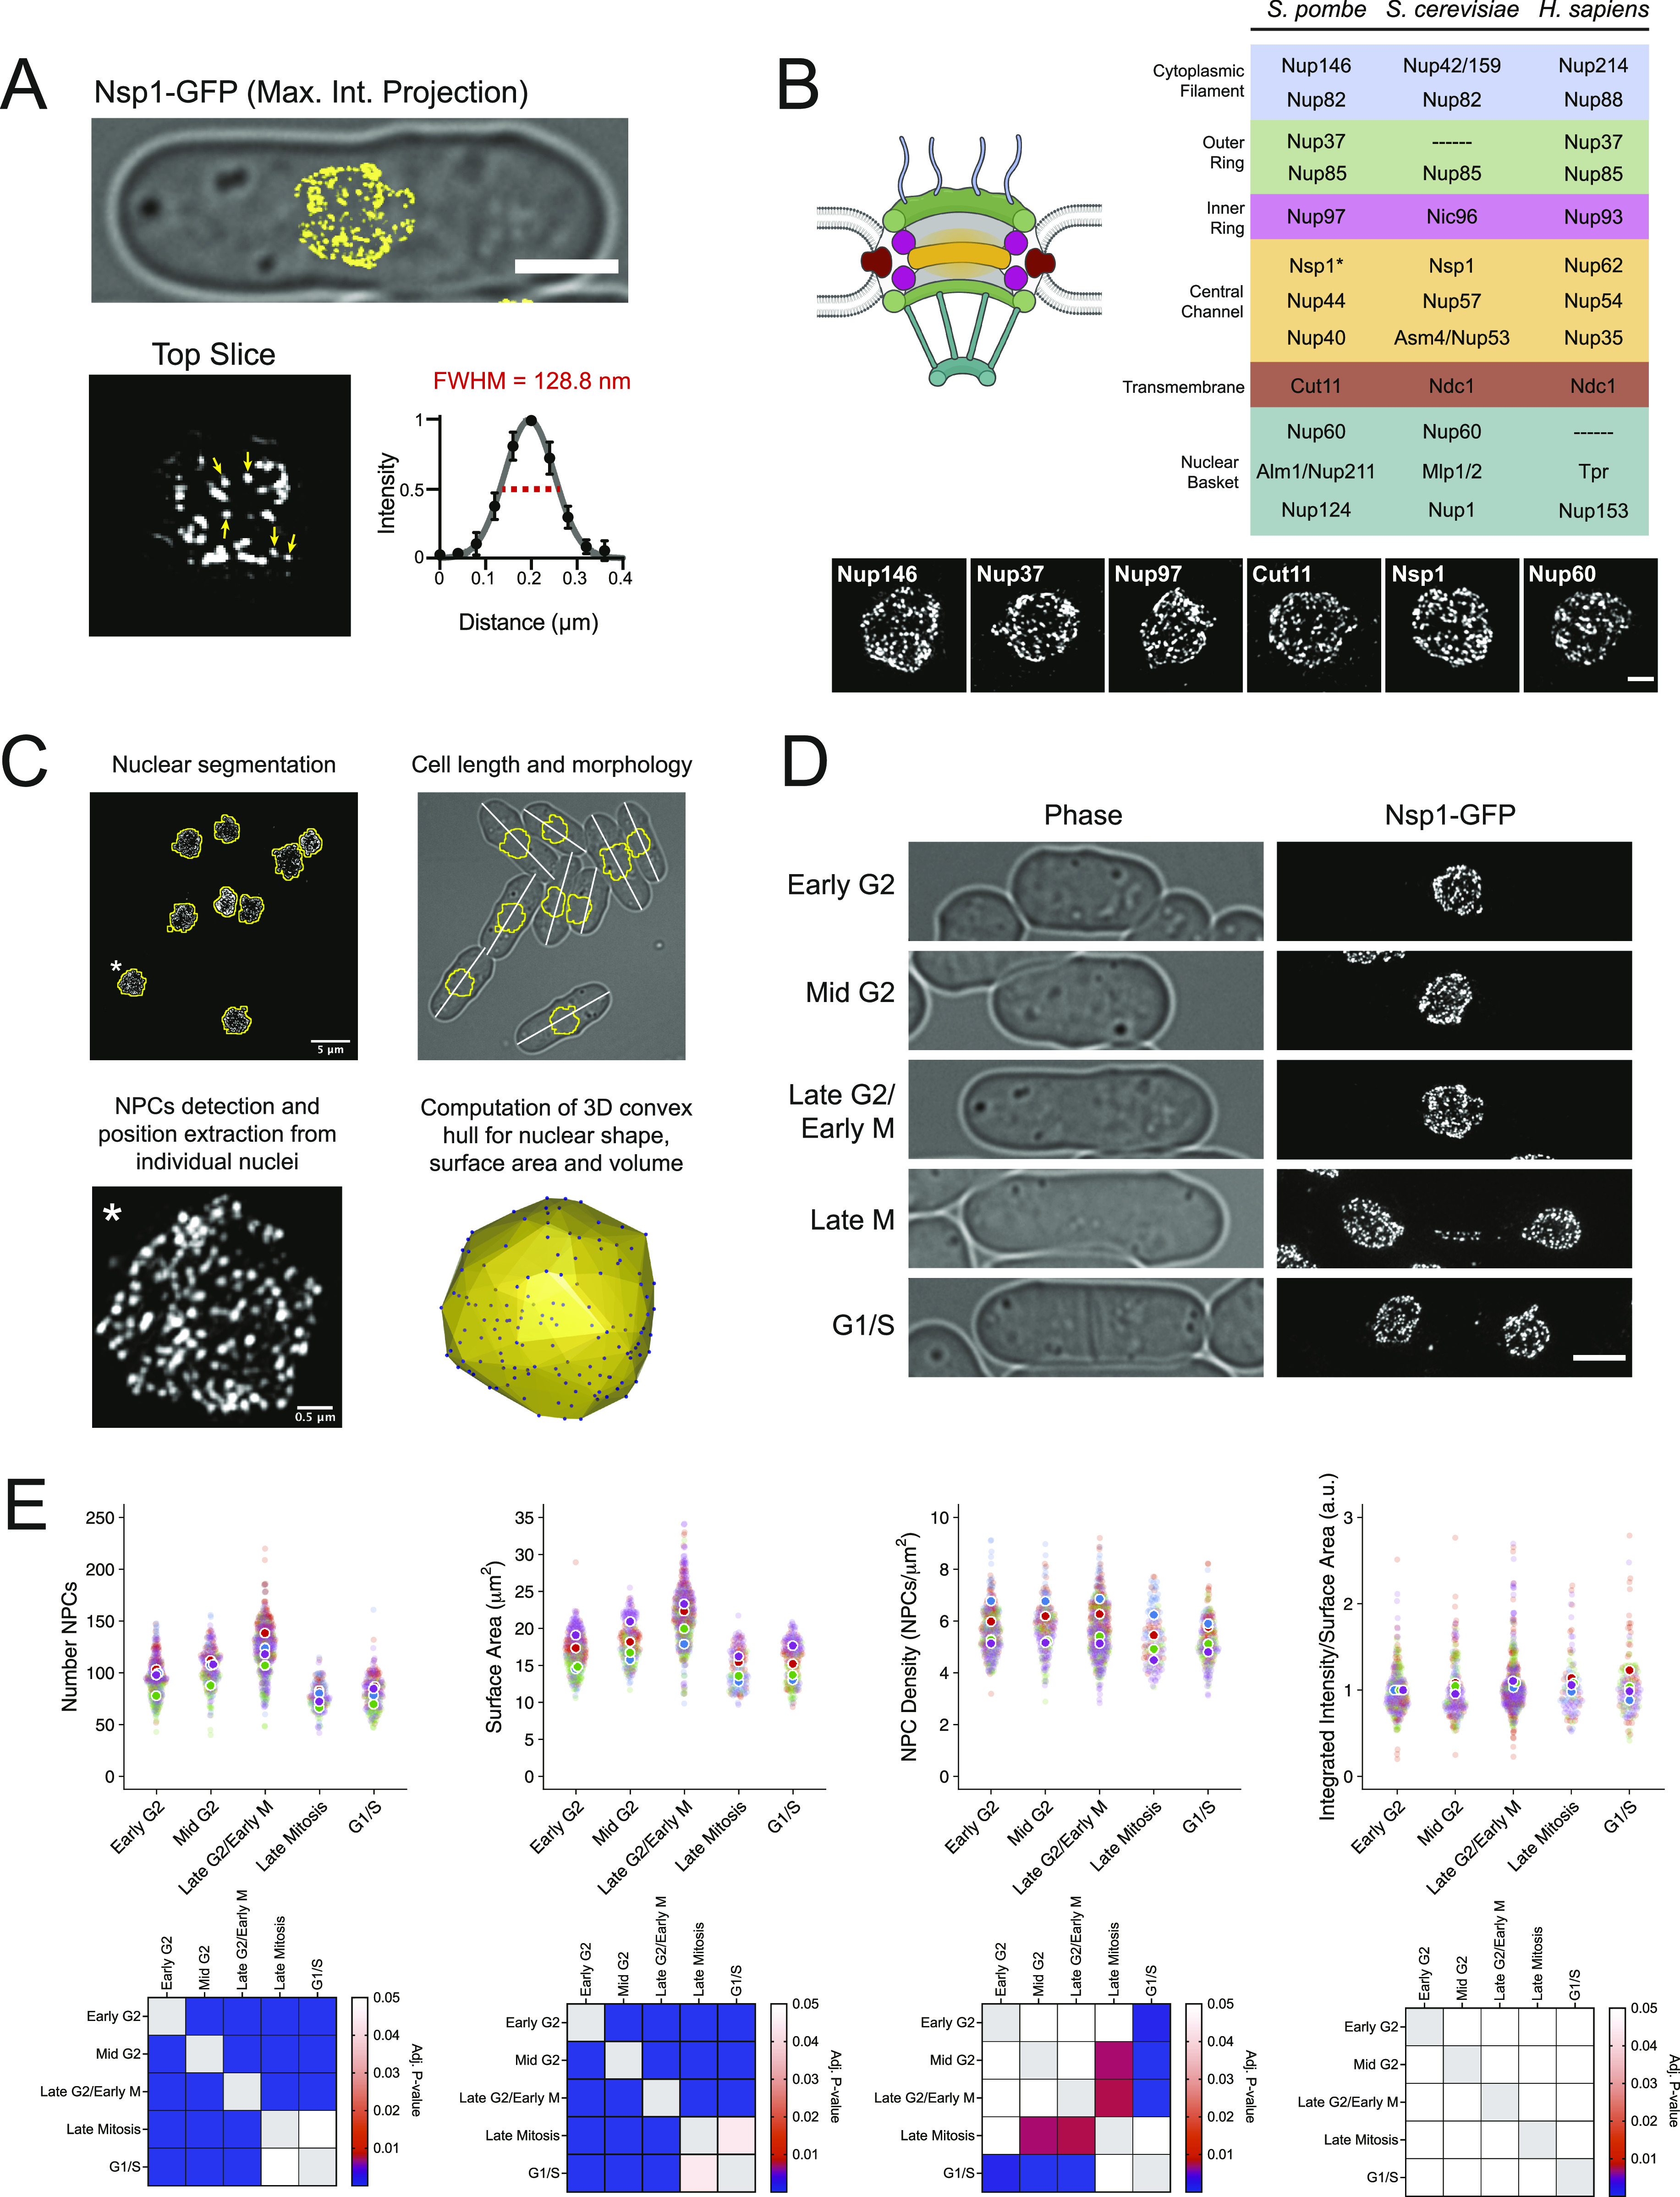
Figure 1. A 3D-SIM imaging and analysis pipeline to measure the nuclear pore complex (NPC) number and density in S. pombe.

(A) 3D-SIM image of Nsp1-GFP overlayed on transmitted light image. Bar, 3 μm. Arrows show five single NPCs fit to a Gaussian to generate the average NPC intensity profile (full-width half-maximum, red dashed line). (B) NPC with sub-complexes colored to match the table of Nups shown on right, with representative 3D-SIM images below. Bar, 1 μm. *Nsp1 present in channel and cytoplasmic complexes. (C) Pipeline for NPC analysis. (D) Representative 3D-SIM image from each cell cycle stage. Bar, 3 μm. (E) NPC number, nuclear surface area, NPC density, and area-normalized intensity measurements from four independent Nsp1-GFP replicates with replicate means indicated by color. Matrices showing all pair-wise comparisons shown below, based on Dunn’s test.
