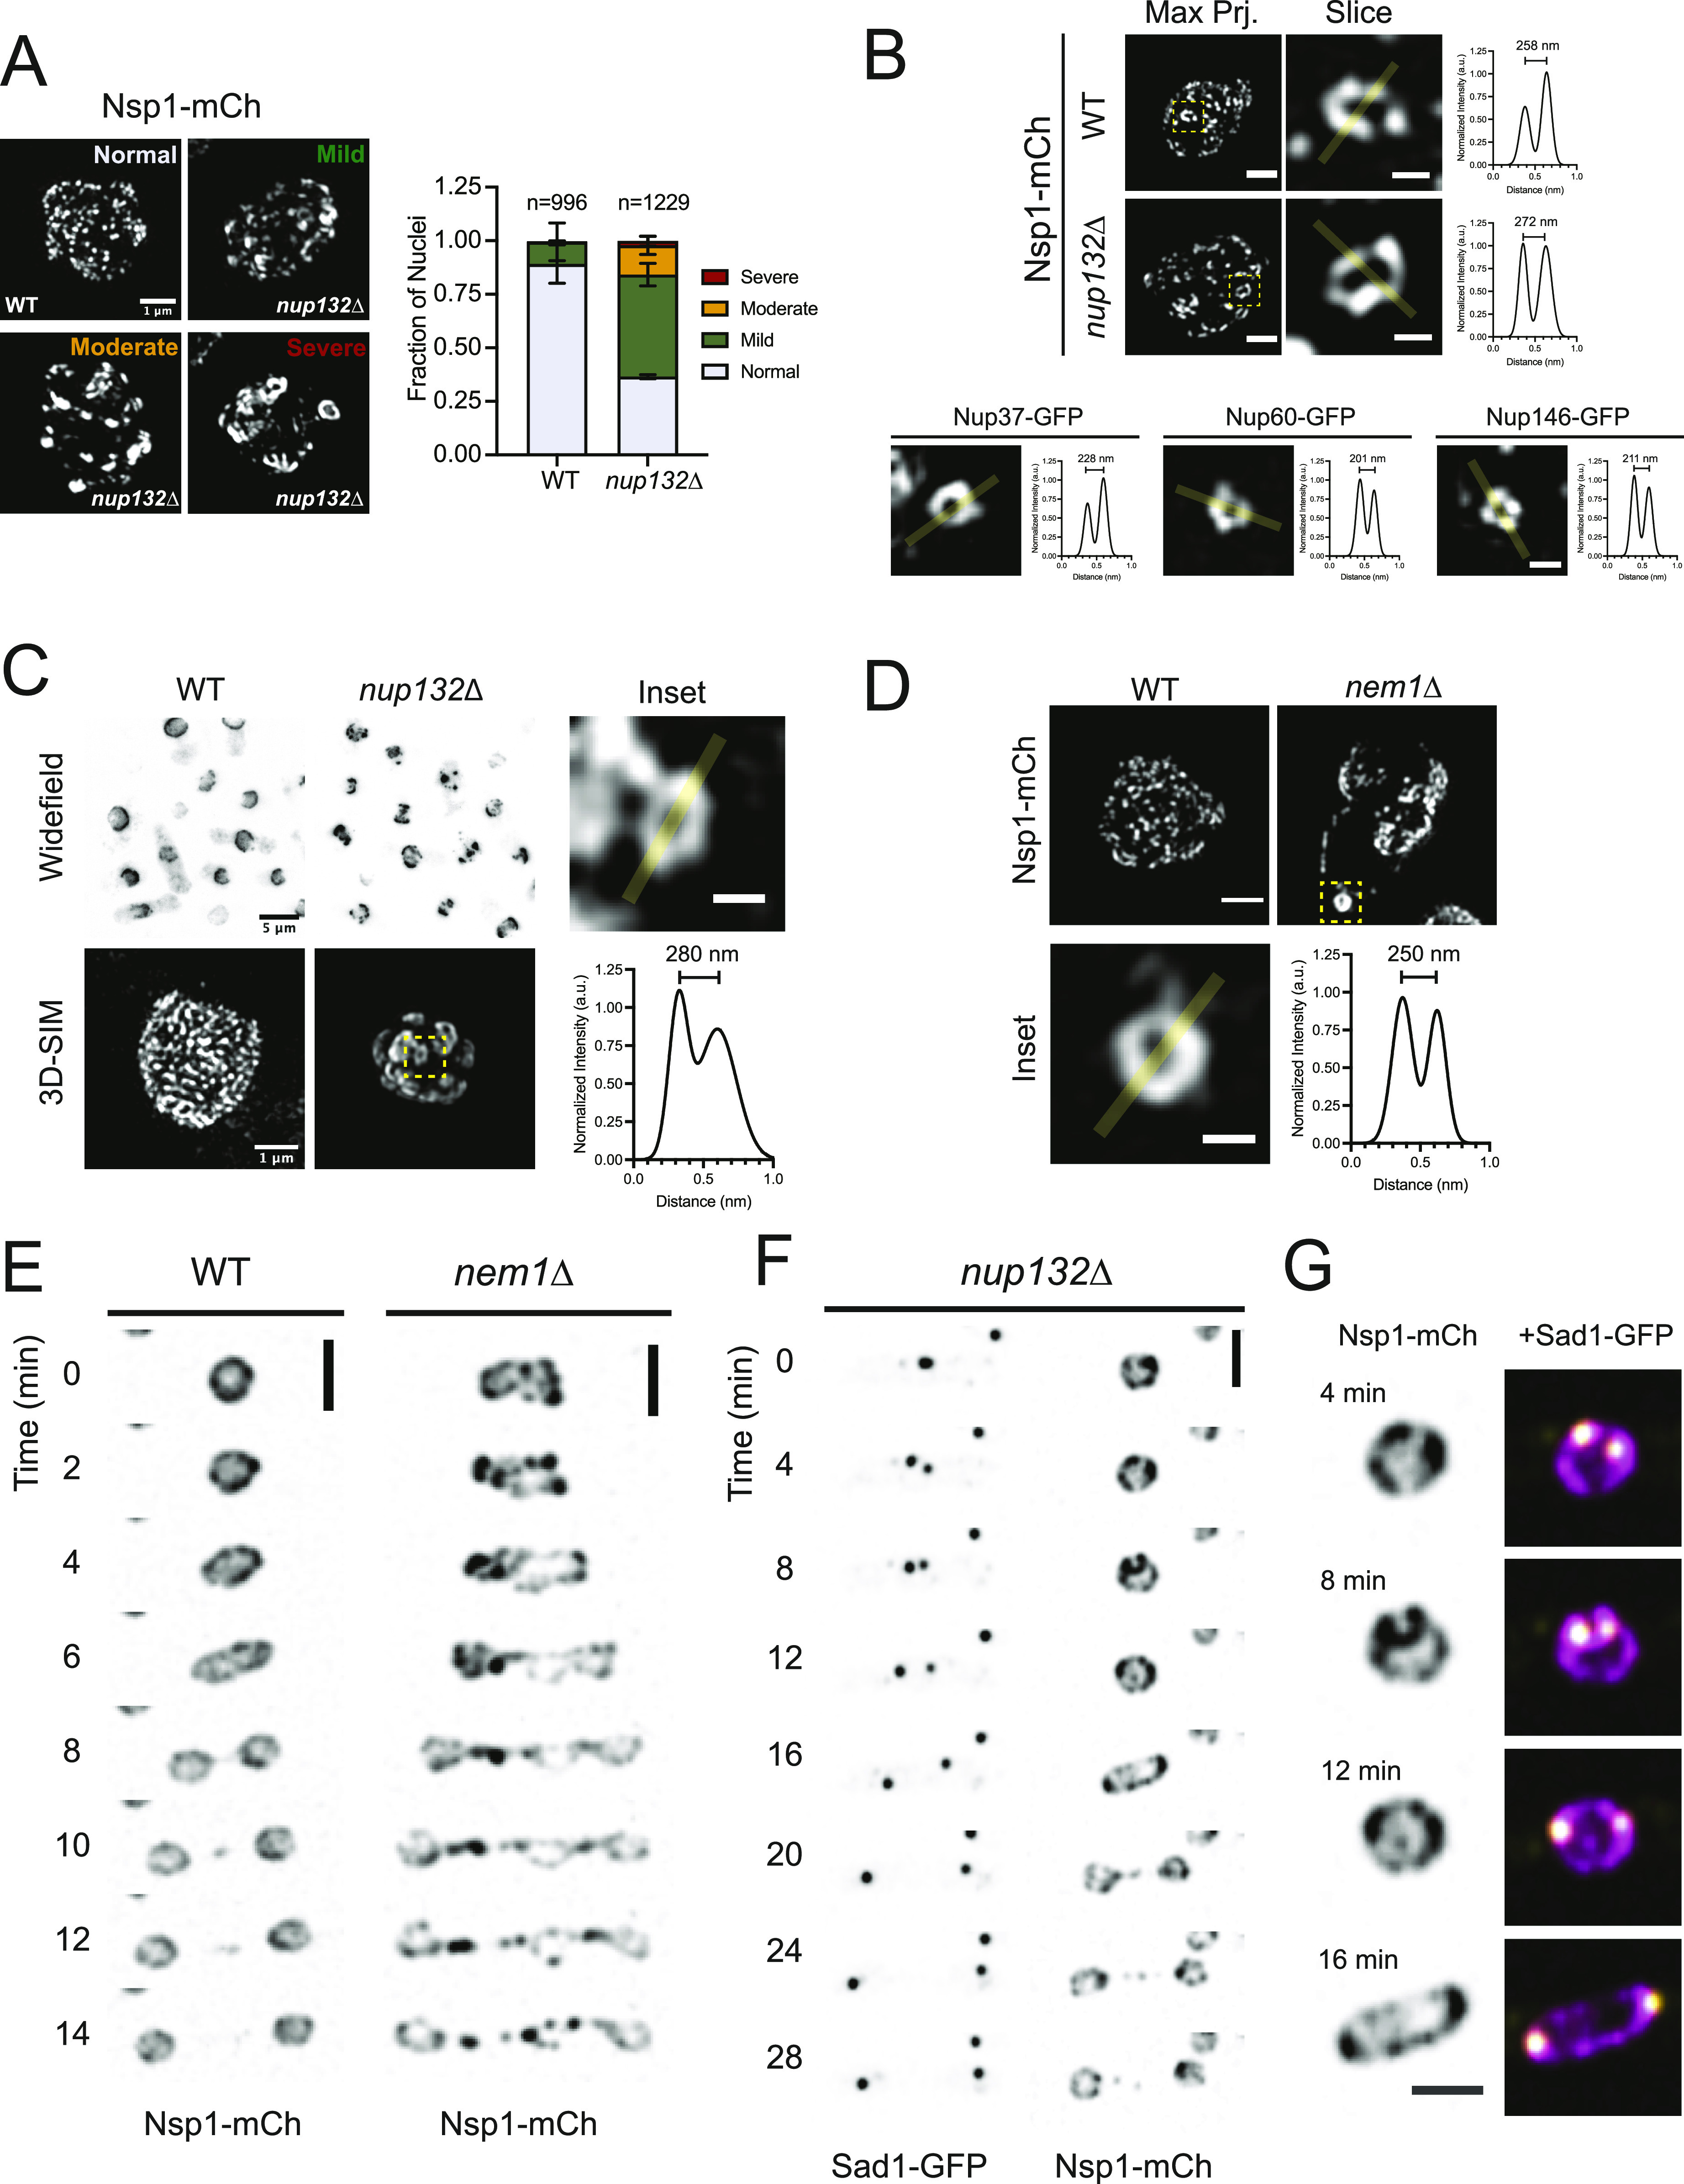
Figure 3. Nuclear pore complex (NPC) cluster organization and dynamics.

(A) 3D-SIM of Nsp1-mCh in wild-type (WT) and nup132∆ cells. Clustering frequency from two independent replicates shown at right. Bar, 1 μm. (B) Ring-like NPC clusters observed by 3D-SIM in projections of the entire nucleus (left; bar, 1 μm) and a subregion (center; bar, 300 nm) with intensity profiles of the highlighted region shown at right. Below, images of ring clusters in WT cells with Nups from multiple subcomplexes. (C) Clustering increases in nup132∆ cells grown on YES agar plates at 25°C for 7 d. (D) 3D-SIM of Nsp1-mCh NPCs in WT and nem1∆ mid-G2 stage nuclei (Bar, 1 μm), with ring cluster shown in the inset (Bar, 300 nm) and plot profile. (E) Montage of time-lapse images of Nsp1-mCh in WT and nem1∆ cells. Bar, 5 μm. (F) Montage of Nsp1-mCh and the spindle pole body component Sad1-GFP in nup132∆ mutants. Bar, 5 μm. (F, G) Insets of nuclei at the indicated time points from montage in (F). Bar, 3 μm; Nsp1, magenta; Sad1, yellow.
