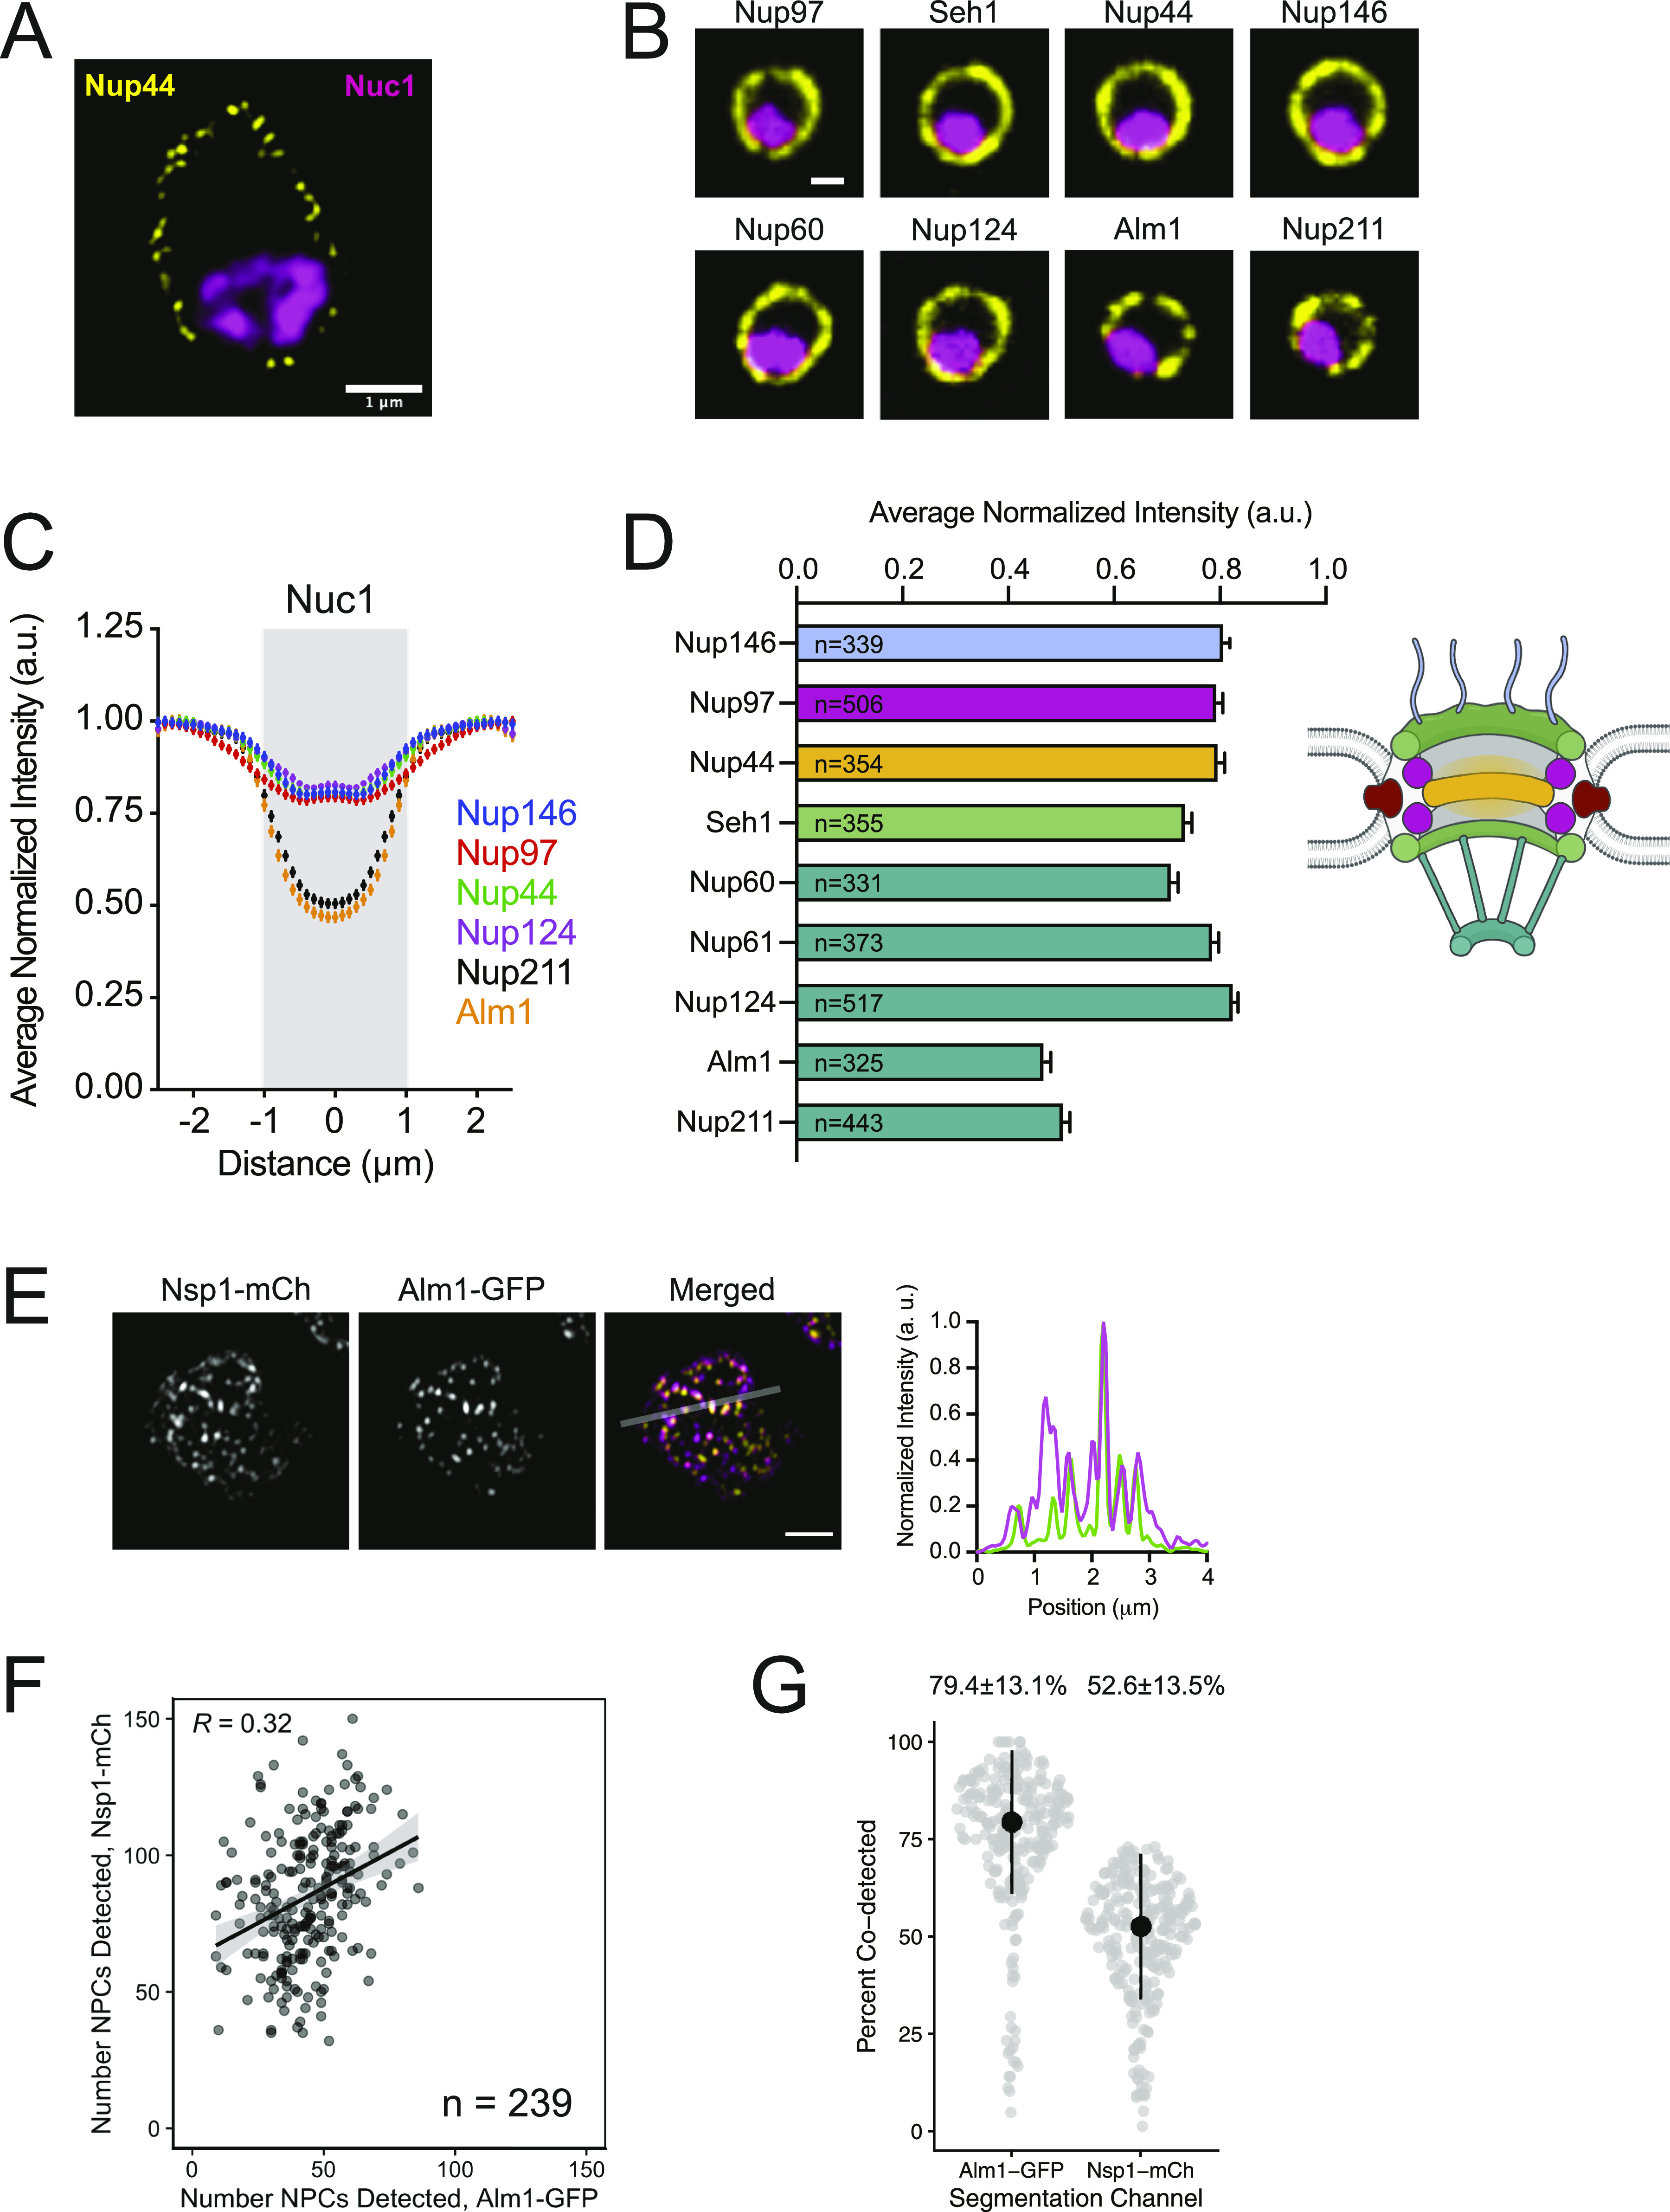
Figure 4. Reduced nuclear pore complex (NPC) density and altered NPC composition at the nucleolus.

(A) Middle slice from 3D-SIM image of Nup44-GFP NPCs and the nucleolus (Nuc1-mCh, processed with Gaussian blur). Bar, 1 μm. (B) Confocal images showing Nups (yellow) and the Nuc1 (magenta). Bar, 1 μm. (C) Averaged profiles of Nup intensities at the nuclear envelope relative to Nuc1 (gray, based on full width half maximum ±95% CI of Nuc1). (C, D) Average Nup intensity at position 0 in intensity profiles from (C), organized by NPC subcomplex. (C, D) Error bars, SD. N, number of nuclei analyzed for panels (C) and (D). (E) 3D-SIM image of Nsp1-mCh and Alm1-GFP with intensity profile of indicated region. (F, G) Comparison of the NPC number and fraction co-detected NPCs. The linear model regression line with 95% CI shown in (F), R, Pearson’s coefficient; median and median absolute deviation indicated above each group in (G).
