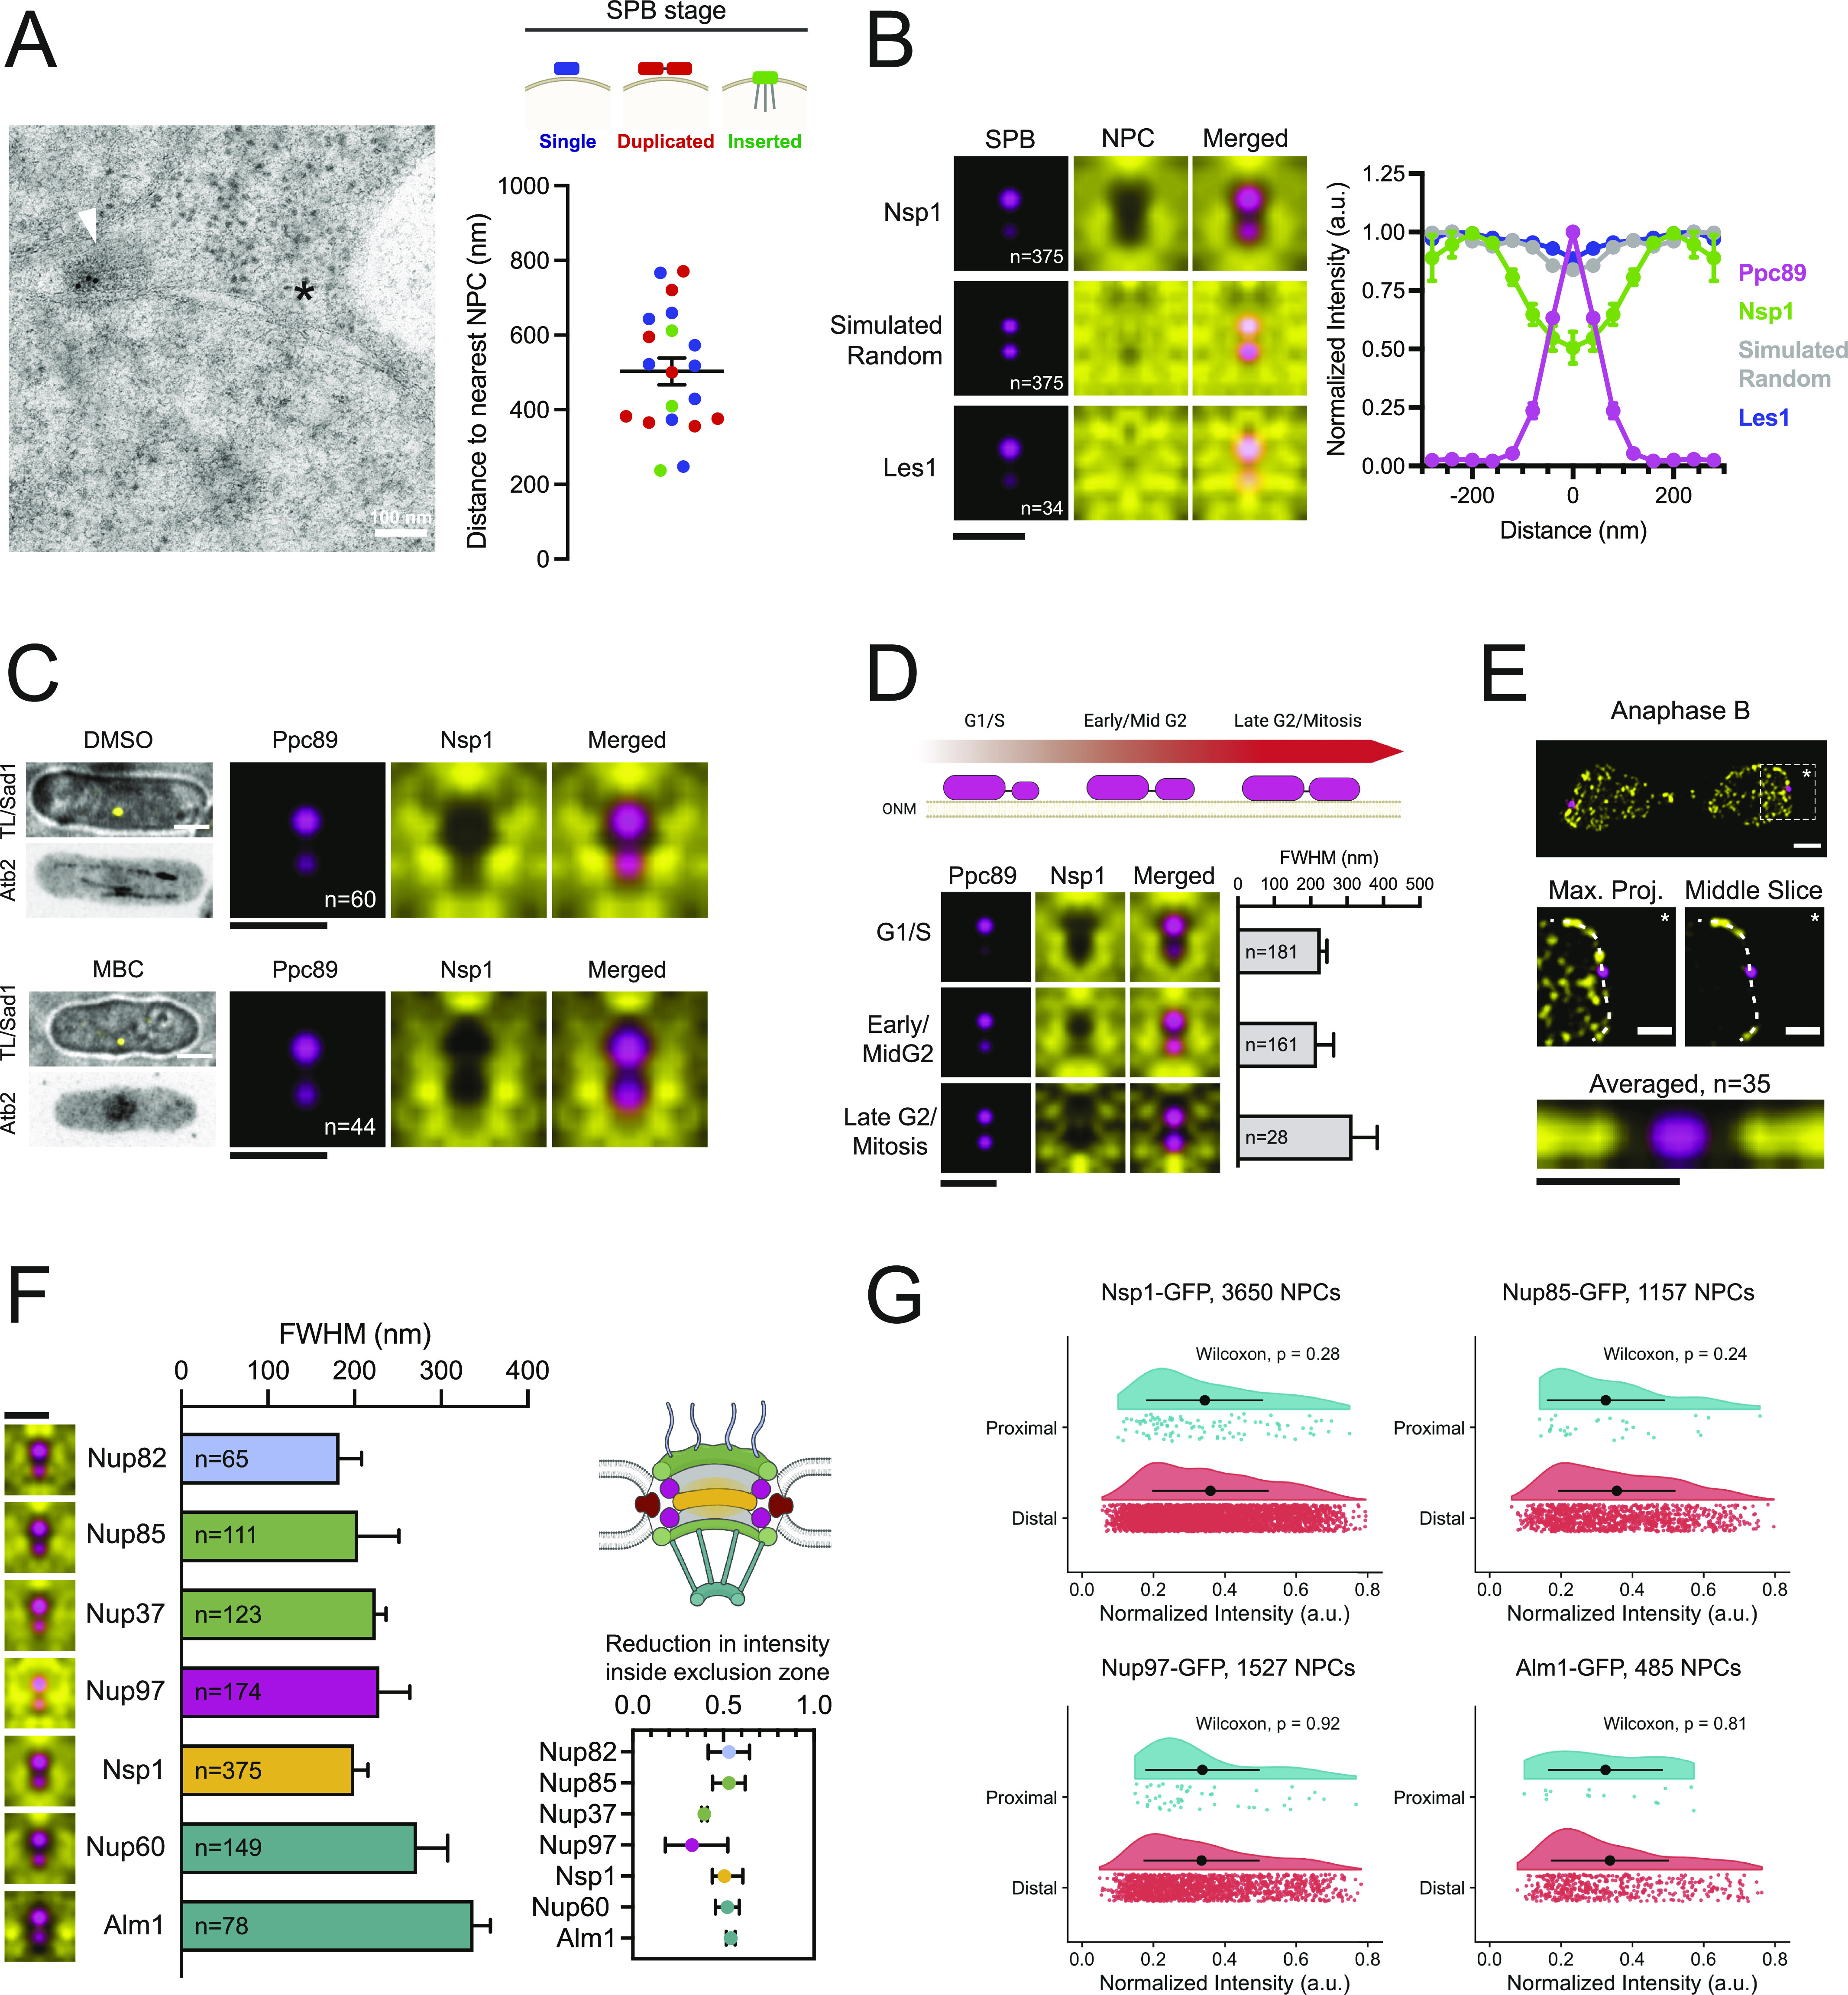
Figure 5. Nuclear pore complex (NPC) exclusion from the spindle pole body (SPB) proximal region of the nuclear envelope.

(A) Immuno-EM of SPB component Ppc1-GFP (arrowhead). The nearest NPC is highlighted with an asterisk. Plot of distance from SPB to the nearest NPC, based on SPB stage: blue = single SPB; red = duplicated SPB; green = inserted SPB. (B) SPA-SIM images of Ppc89-mCh (magenta) and Nsp1-GFP (NPCs), Les1-GFP and simulated random distributions (yellow). Normalized intensity profiles across the mother and daughter SPBs. Error bars, SD. Bar, 0.5 μm. (C) Confocal image for microtubules (mCh-Atb2) and SPBs (Sad1-GFP) in cells treated with DMSO (control) or 25 μg/ml MBC for 1 h. Bar, 3 μm. SPA-SIM images of Ppc89-mCh (magenta) and Nsp1-GFP (yellow) for cells similarly treated. Bar, 0.5 μm. (D) Schematic of SPB duplication. SPA-SIM images of Ppc89-mCh (magenta) and Nsp1-GFP (yellow) based on daughter/mother Ppc89-mCh intensity ratios (G1/S, 0.5; Early/Mid G2, 0.5–0.8; Late G2/Mitosis, ≥0.8). Plot of full width half maximum of Nsp1 exclusion zone for each stage. Error bars, 95% CI. Bar, 0.5 μm. (E) 3D-SIM projection of Nsp1-GFP (yellow) and Ppc89-mCh (magenta) in anaphase. Bar, 1 μm. Enlarged images of SPB region, showing maximum projection and single middle z-slice. Bar, 0.5 μm. Averaged image of Nsp1-GFP NPCs relative to SPB in mitotically dividing nuclei. Bar, 0.5 μm. (D, F) SPA-SIM images of Nups (yellow) and SPBs (magenta), along with full width half maximum plot as in (D). Most of the Nups have ∼50% reduction in intensity near the SPB relative to the surrounding nuclear envelope. Bar, 0.5 μm. (G) Kernel-smoothed density distributions of Nup-GFP intensities for NPC foci that were proximal (<100 nm) or distal (>100 nm) to the SPB. Nup intensities for proximal and distal NPCs were compared using the unpaired Wilcoxon rank-sum test. Black dots represent the mean normalized intensity value, and error bars show SD.
