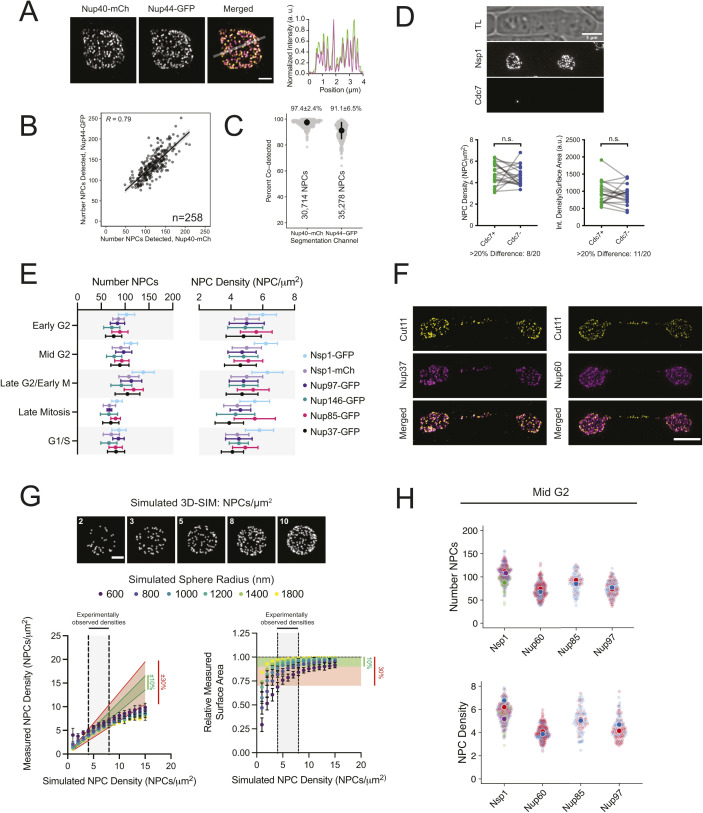
Figure S1. Nuclear pore complex (NPC) analysis.
(A) 3D-SIM of Nup40-mCh/Nup44–GFP co-labeled NPCs with intensity profile. Bar, 1 μm. (B, C) Comparison of NPC number and fraction co-detected NPCs. Regression with 95% CI; R, Pearson’s coefficient; n, number of nuclei for panel (B); median and median absolute deviation indicated above each group in panel (C). (D) SIM image of Nsp1-mCh and Cdc7-GFP, with plots of NPC density and area-normalized intensity for paired nuclei based on Cdc7 status below; ns, nonsignificant, Wilcoxon matched-pairs test. (E) NPC number and density by cell cycle stage for multiple tagged Nups. Error bars, SD. (F) 3D-SIM projections of late anaphase nuclei with Cut11-GFP (yellow) and Nup37-mCh or Nup60-mCh (magenta). Bar, 3 μm. (G) Projections of simulated 3D NPC distributions at densities ranging from 2 to 10 NPCs/μm2. Bar, 1 μm. Graphs comparing the true simulated NPC density and surface areas with the values obtained from the NPC analysis pipeline outlined in Fig 1C. Predicted ranges for values with 10% (green) and/or 30% (red) error ranges are highlighted. (H) Comparison of the NPC number and densities for multiple GFP-tagged Nups highlighting reproducibility between biological replicates (indicated by color; four replicates for Nsp1, two each for others).

