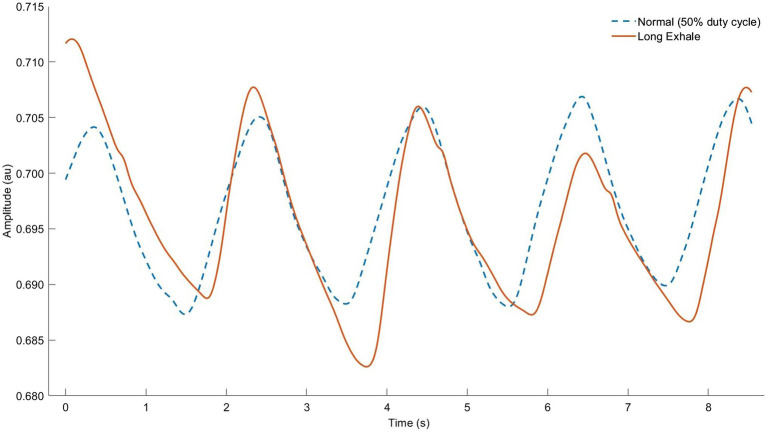
Figure 6.
Respiratory inductance plethysmography (RIP) data from our lab showing normal breathing (dashed line) vs. “active exhale” breathing strategy (solid line). Note that raw RIP data depict inductance, where signal increases (upward slope) correspond to the exhale phase. Observe the identical breath cycle time, but shorter relative inhale and longer exhale (smaller breath ratio) as well as lower average lung operating volume throughout the breath cycle (higher signal units indicating decreased sensor stretch).

