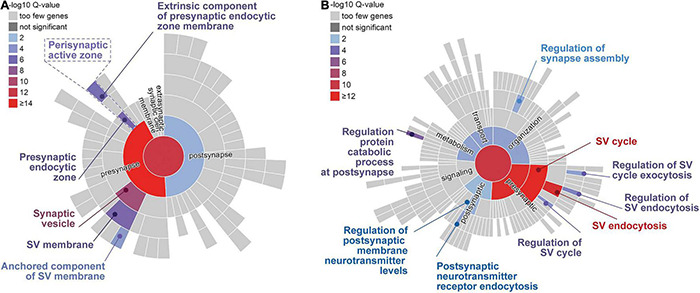
FIGURE 2.

Sunburst plots of gene enrichment analyses for autophagy-related genes/proteins included in SynGO (Koopmans et al., 2019). Significantly enriched cellular components (A) and biological processes (B) are indicated by color code. The top-level terms of the Gene Ontology (GO) term tree are represented by the inner circle; the second level of the term tree is denoted by the innermost ring and so on. Presynaptic structures (A) and processes, like synaptic vesicle (SV) cycle and SV endocytosis (B) are significantly over-represented. Note, autophagy-related terms were not annotated in the database. Database entries for cellular components and for biological processes were considered as indicated in Table 1.
