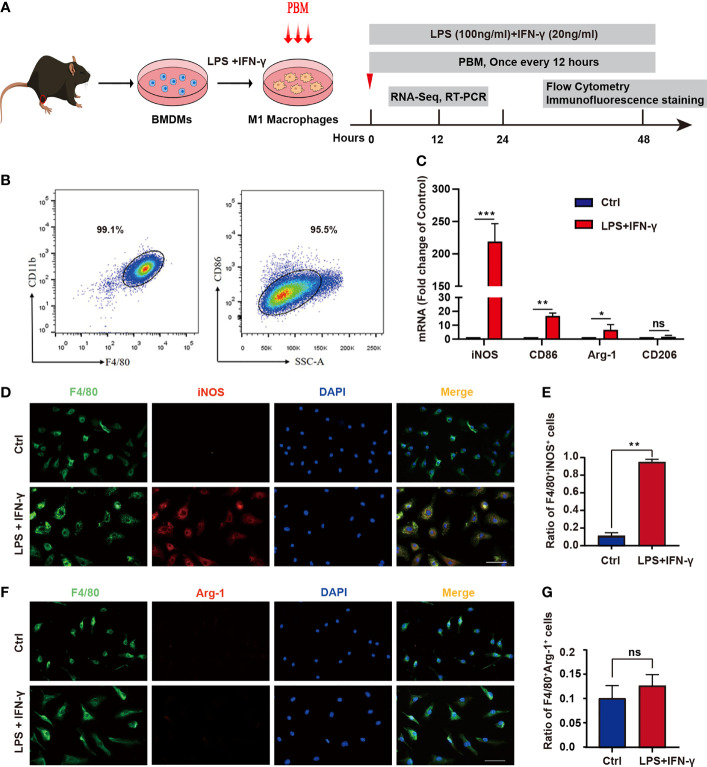
Figure 2.
Identification of BMDMs and induction of neurotoxic macrophages. (A) Schematic diagram of extraction of mouse BMDMs and induction of M1-type polarization and timeline of the experimental design. (B) BMDMs were identified by examining the macrophage markers F4/80 and CD11b using flow cytometry. (C) The expression of M1 markers (iNOS and CD86) and M2 markers (Arg1 and CD206) was detected by RT–PCR in the control group and the LPS + IFN-γ-treated group. (D) Immunofluorescence staining was used. Red: the M1 macrophage marker iNOS; green: the macrophage marker F4/80; blue: DAPI (nucleated cells) in untreated and LPS + IFN-γ-treated cells. Scale bar = 50 mm. (E) The ratio of F4/80+iNOS+ cells in the control group and in the LPS- and IFN-γ-treated groups. (F) Immunofluorescence staining was used. Red: the M2 macrophage marker Arg1; green: the macrophage marker F4/80; blue: DAPI (nucleated cells) in untreated and LPS + IFN-γ-treated cells. Scale bar = 50 mm. (G) The ratio of F4/80+Arg1+ in the control group and in the LPS- and IFN-γ-treated groups (all experiments in this group were independently repeated three times). *P < 0.05, **P < 0.01, ***P < 0.001; ns, not significant.

