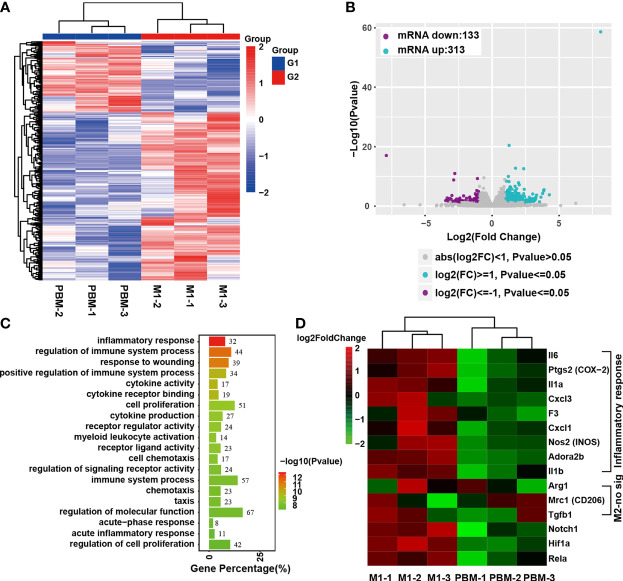
Figure 4.
Transcriptome analysis of the effect of PBM on M1 macrophages. (A, B) There were 446 genes that were significantly altered, with 313 upregulated and 133 downregulated. (C) GO analysis of the differentially expressed genes (DEGs). (D) Heatmap of DEGs associated with inflammatory responses in macrophages. The heatmap shows that Notch1 and HIF-1α are downregulated genes related to inflammation regulation. IL-6, PTGS2 (COX-2), and IL-1α were the three genes with the largest fold differences among the inflammatory response-related DEGs, with p values less than 0.01 (this experiment was independently repeated three times).

