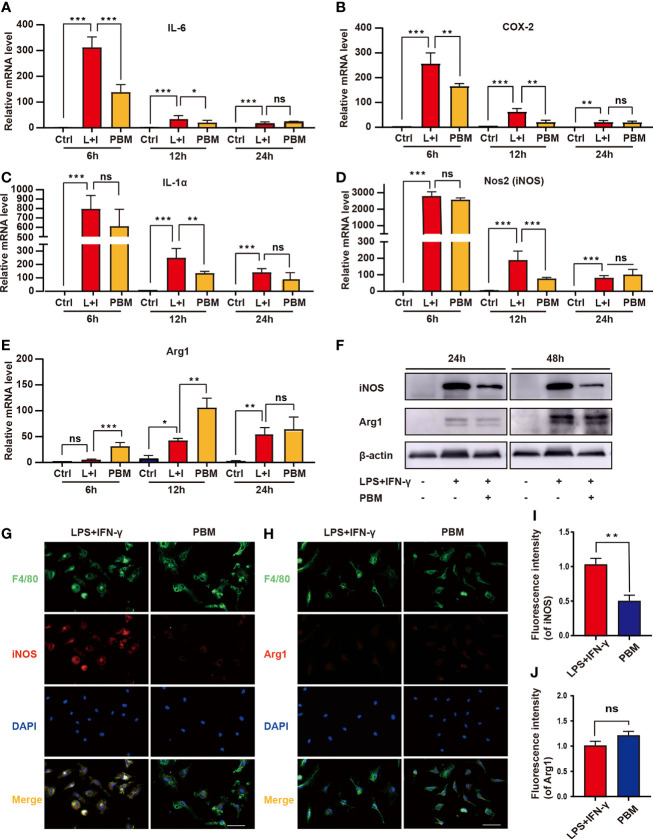
Figure 5.
In vitro validation of the regulation of inflammation-related genes by PBM. (A–E) The expression of M1-related genes (NOS2, IL-1α, IL-6, and COX-2) and M2-related genes (Arg1) in the Ctrl (M0), L+I (LPS + IFN-γ), and PBM (LPS + IFN-γ + PBM) groups was detected by RT–PCR at the 6th, 12th and 24th hours after PBM intervention (n = 3 per group). (F) Representative immunoblots of Arg1 (M2 macrophage marker) and iNOS (M1 macrophage marker) in the Ctrl (M0), L+I (LPS + IFN-γ), and PBM (LPS + IFN-γ + PBM) groups at 24 and 48 hours after the first PBM intervention (n = 3 per group). (G, I) Representative images of F4/80 (green), iNOS (red) and DAPI (blue) immunofluorescence staining in the LPS + IFN-γ and PBM (LPS + IFN-γ + PBM) groups (n = 3 per group). (H, J) Representative images of F4/80 (green), Arg1 (red), and DAPI (blue) immunofluorescence staining in the LPS + IFN-γ and PBM (LPS + IFN-γ + PBM) groups (n = 3 per group at each time point). *P < 0.05, **P < 0.01, ***P < 0.001; ns, not significant.

