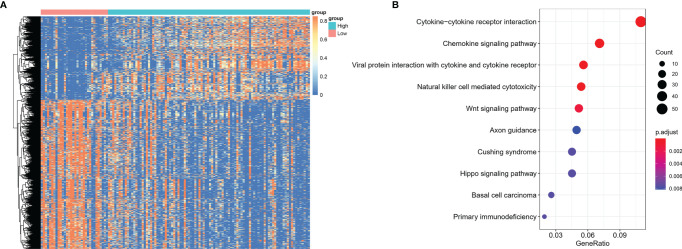
Figure 6.
Differentially expressed genes between NKTCL patients with high and low expression of CD56. (A) Heatmap shows the differentially expressed genes among groups, which were determined by significance criteria (abs(log2FC)>1 and adjusted P value<0.05) as implemented in the R package limma. The heatmap was drawn by pheatmap R package according to the differentially expressed genes. Unsupervised analyzing and hierarchical clustering of common differentially expressed genes based on expression data. (B) Gene annotation enrichment analysis using the clusterProfiler R package was performed on signature genes. The top five pathways with the greatest enrichment were Cytokine-cytokine receptor interaction, Chemokine signaling pathway, Viral protein interaction with cytokine and cytokine receptor, Natural killer cell mediated cytotoxicity, Wnt signaling pathway.

