Figure 1.
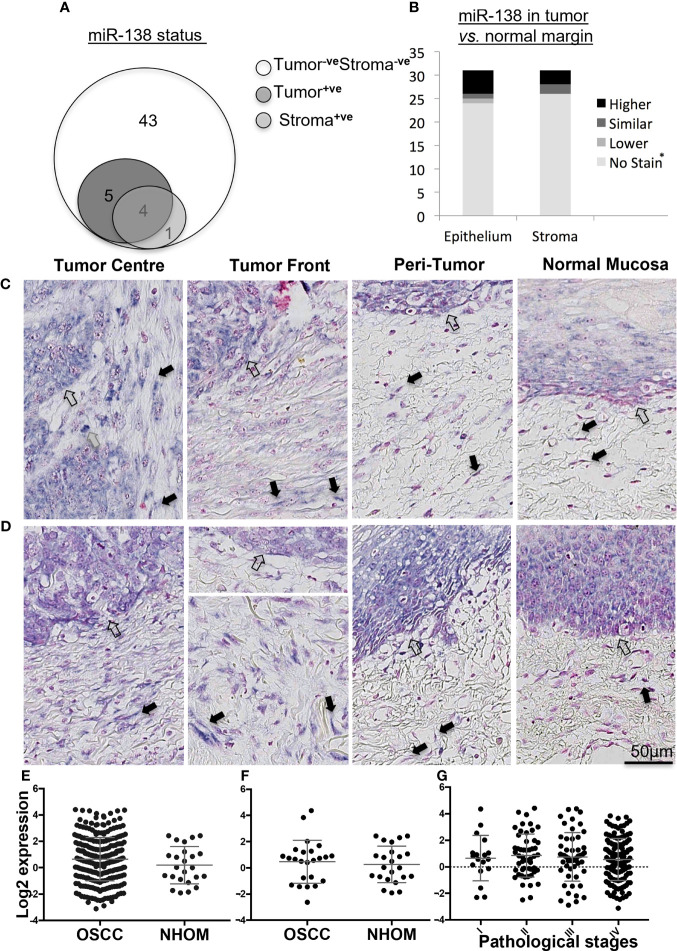
Expression of miR-138 in OSCC. (A) Venn diagram showing distribution of OSCC cases according to miR-138 staining positivity in the epithelial and tumor-associated stroma regions. (B) Stacked bar plot comparing the miR-138 expression in epithelial and stromal compartments in the OSCC lesions compared to peritumoral/normal margins. *-veStain in both tumor and adjacent normal/peritumor area. (C) Higher miR-138 expression in cancer cells in tumor center (TC) and tumor front (TF) compared to adjacent peritumor (PT) and normal (TN) areas. (D) Higher expression in PT region compared to TC and TF. Lymphocytes, fibroblasts, and epithelial/malignant compartment in gray, black, and unfilled arrows, respectively. (E) TCGA miR-138 expression in between OSCC and matched NHOM, (F) OSCC and unmatched NHOM, and (G) among pathological stages in OSCC. Unpaired t-test, paired t-test, and one-way ANOVA, respectively, for (C–E).

