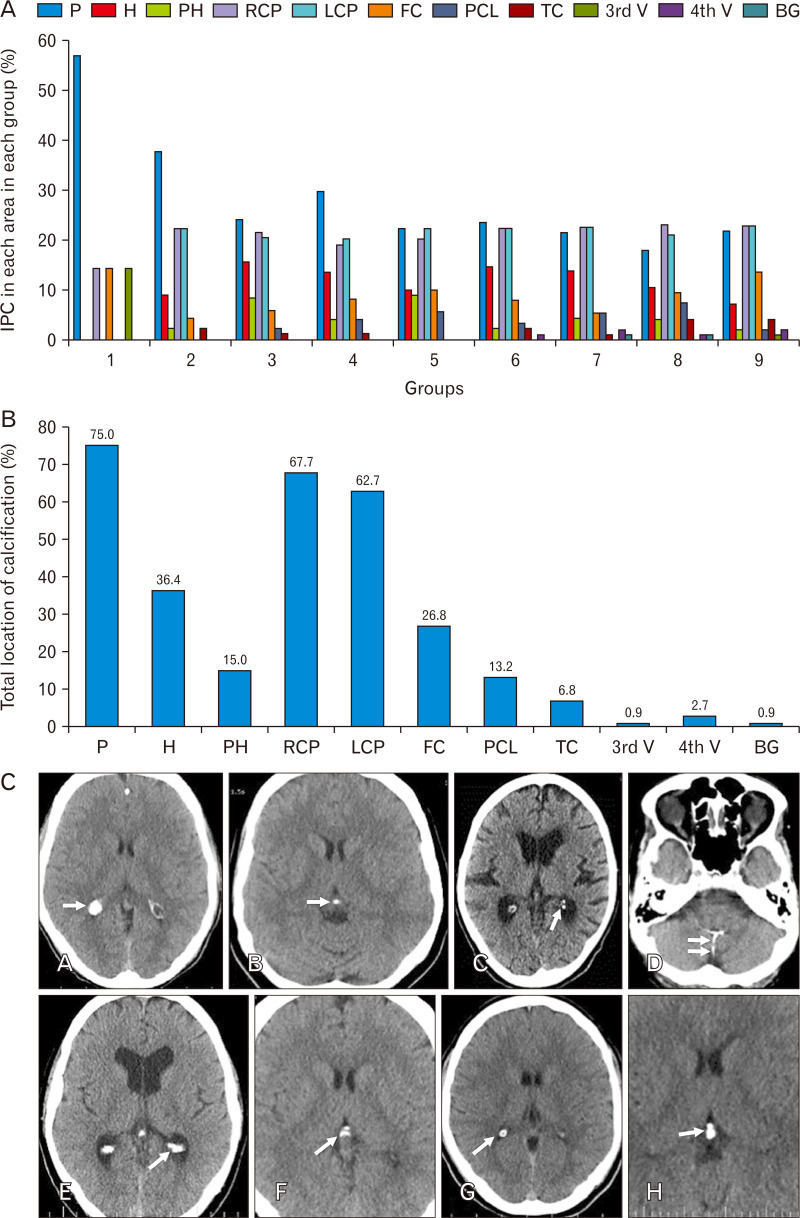
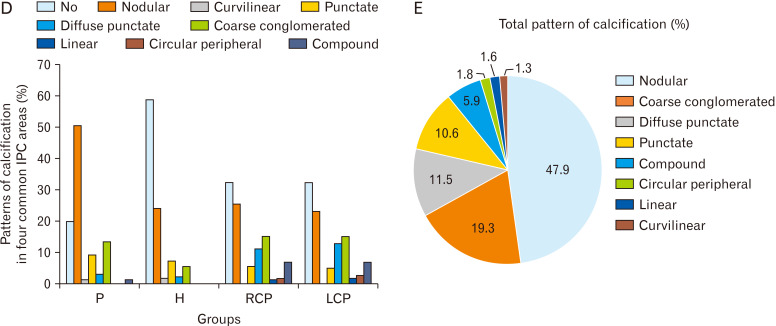
Fig. 2.
(A) Percent of IPC in each area in each group. (B) Total location of IPC (percent). (C) Corresponding brain computed tomography images of various IPC patterns (A: nodular [dimensions ≥1 mm]; B: punctate [dimensions ≤1 mm]; C: diffuse punctate [multiple punctate calcifications]; D: linear; E: coarse conglomerated; F: curvilinear; G: circular peripheral; H: compound [pineohabenular calcification]). Arrow shows the calcification. (D) Percent of patterns of calcification in four common IPC areas. (E) Total pattern of calcification. IPC, intracranial physiologic calcification; P, pineal; H, habenula; PH, pineohabenula; RCP, right choroid plexus; LCP, left choroid plexus; FC, falx cerebri; PCL, petroclinoid ligament; TC, tentorium cerebelli; V, ventricle; BG, basal ganglia.


