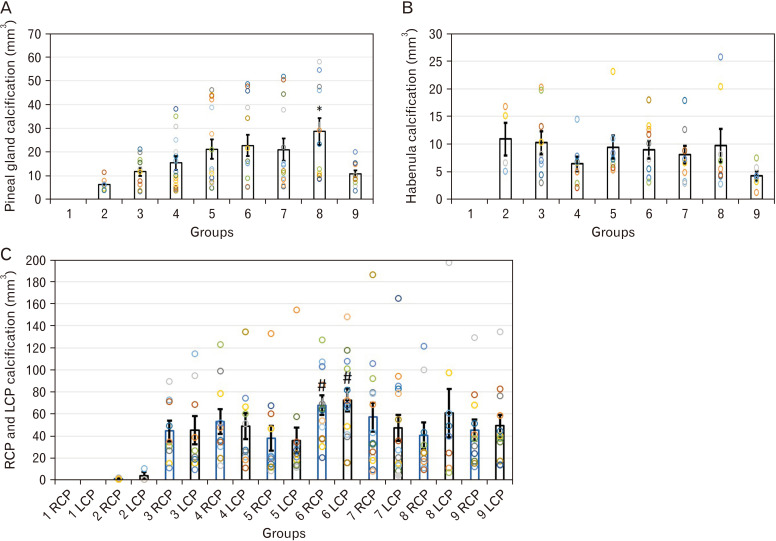
Fig. 3.
(A) Estimated volume of pineal gland calcification. (B) Estimated volume of habenula calcification. (C) Estimated volume of RCP (blue boxes) and LCP calcification (black boxes). *P≤0.05 vs. group 2; #P≤0.05 vs. group 2. Data are reported as boxes with error bars indicating mean±SEM, and various circles in each column indicate individual data points. RCP, right choroid plexus; LCP, left choroid plexus.

