Figure 2.
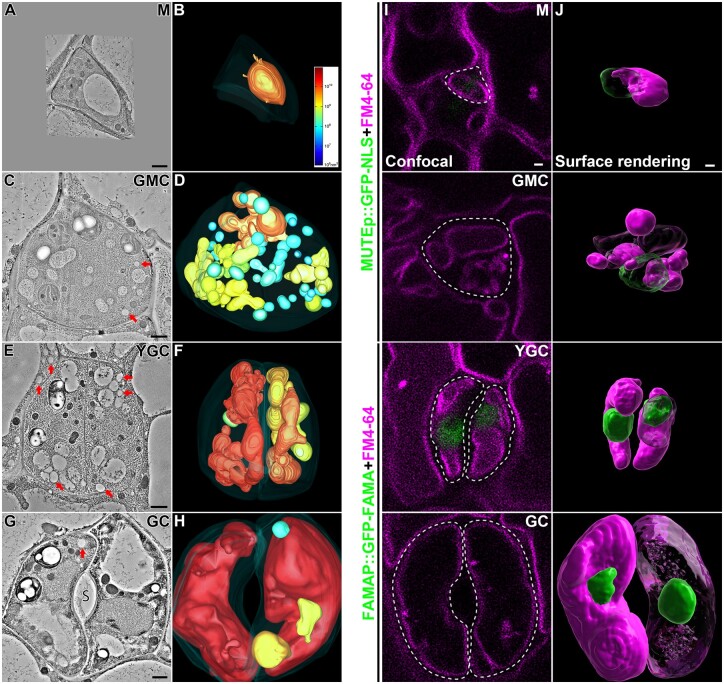
Whole-cell ET analyses and surface renderings of vacuoles in stomatal lineage cells of Arabidopsis cotyledon epidermis. A–H, Representative tomographic slices generated from 250-nm-thick sections of four stomatal lineage cells, M (meristemoid), GMC, YGC, and opening mature GC are shown in (A), (C), (E), and (G), respectively. Their corresponding 3D whole-cell vacuole models (B, D, F, and H) were built and color-coded according to the vacuole volume. The color scale bar in (B) indicates the colors representing certain vacuole volume. The PM is shown in semi-transparent fashion. The arrows indicate examples of LDs. S, stoma. Scale bars, 1,000 nm. Also see Supplemental Movies S1–S4. I, J, Surface renderings of vacuoles and nuclei from stomatal lineage cells. Cotyledons from 3-d-old transgenic Arabidopsis plants expressing nucleus markers (MUTEp::GFP-NLS in meristemoid and GMC, and FAMAp::GFP-NLS in YGC and GC) were proceeded for overnight incubation of FM4–64 and subsequent constant washing in half-strength MS for 5 h in orbital shaker. Confocal images of stomatal lineage cells were taken, each of which was a stack of about 30 single images with 0.4-mm interval. Representative optical slices of each cell were shown, with green (GFP) and magenta (FM4–64) fluorescent channels (I). Cell boundaries are displayed in dash lines. Note that no visible nuclear signal was observed on the focal planes of M, GMC, and GC. Z-stack images were proceeded to Imaris software for surface renderings of vacuoles (magenta) and nuclei (green) (J). Note that parts of nuclei and vacuoles were transparentized. Scale bars, 1,000 nm for all panels.

