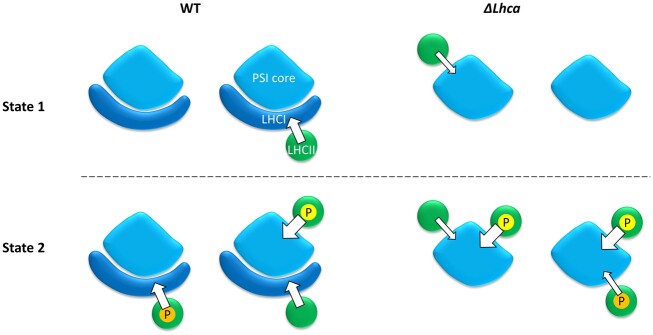
Figure 6.
Rate of energy transfer from LHCII to PSI in State 1 and State 2 stroma lamellae membranes from WT and ΔLhca plants. The width of the arrow represents the rate of the energy transfer. The number of LHCII trimers per PSI complex is based on the SDS–PAGE data. Color coding: green–LHCII trimer; light blue–PSI core; dark blue– LHCI; P in yellow circle–phosphate group on Lhcb2 associating with the PsaH site of the PSI core; P in orange circle–phosphate group on digitonin-sensitive LHCII.

