
Figure 8.
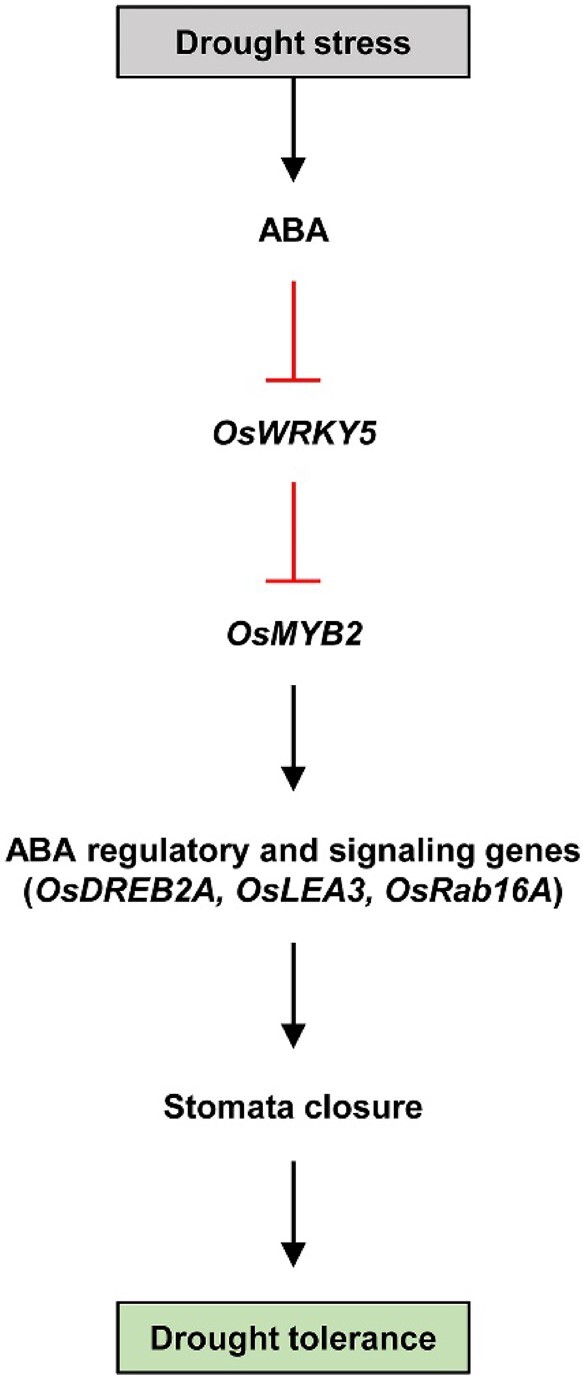
Proposed model of the negative roles of OsWRKY5 in drought tolerance. Solid lines represent direct regulation of downstream genes, respectively. Arrows indicate upregulation, and lines ending with bars represent downregulation. Red lines represent our findings in this study.