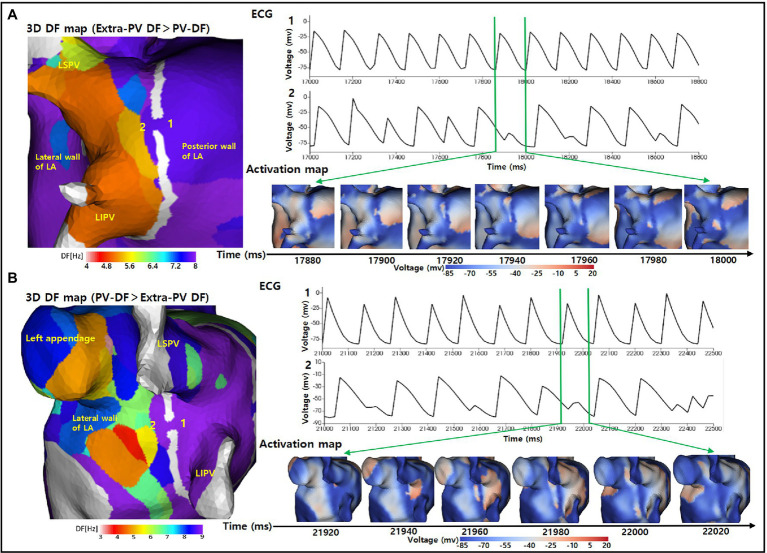
Figure 4.
Wave-break at the wavelet exit of the gaps by a source-sink mismatch. (A) The 3D DF map indicates that the extra-PV DFs was greater than the PV-DFs. The activation map and ECG indicate that a regular wavelet turned into a wave-break when moving from the posterior wall of the LA to inside the PV through the gap. (B) The 3D DF map indicates that the inside PV-DF was greater than the extra-PV DF. The activation map and ECG indicate that a regular wavelet turned into a wave-break when moving from inside the PV to the lateral wall of the LA through the gap. DF indicates dominant frequency; PV, pulmonary vein; LA, left atrium; LSPV, left superior pulmonary vein; LIPV, left inferior pulmonary vein; ECG, Electrocardiogram.

