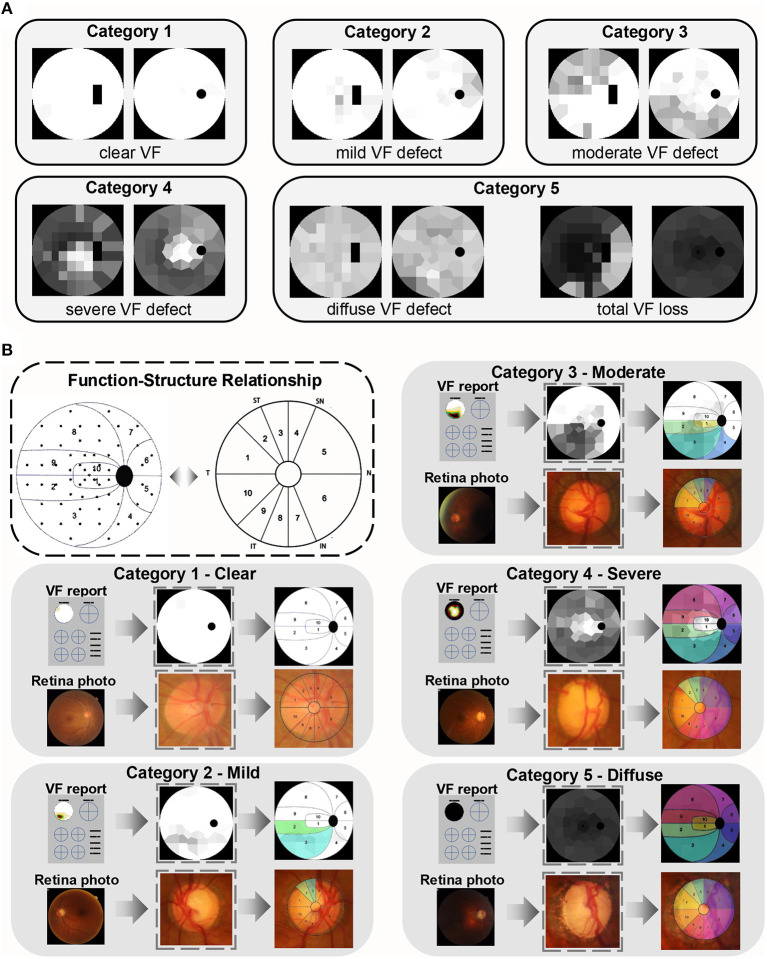
Figure 4.
Function–structural relationship of glaucomatous damage. (A) Examples of categories 1–5. The left column is the Humphrey Field Analyzer data and the right column is Octopus data. (B) The function–structure relationship and the partition in the dotted box were proposed and verified by the previous study. The example of each category is in the gray box. The first row shows the VF reports, converted Voronoi images, and their partition, and the colored area represents the damage. The second row is the corresponding fundus photos, its optic nerve head, and the same colored area demonstrating the related structure damage on fundus.

