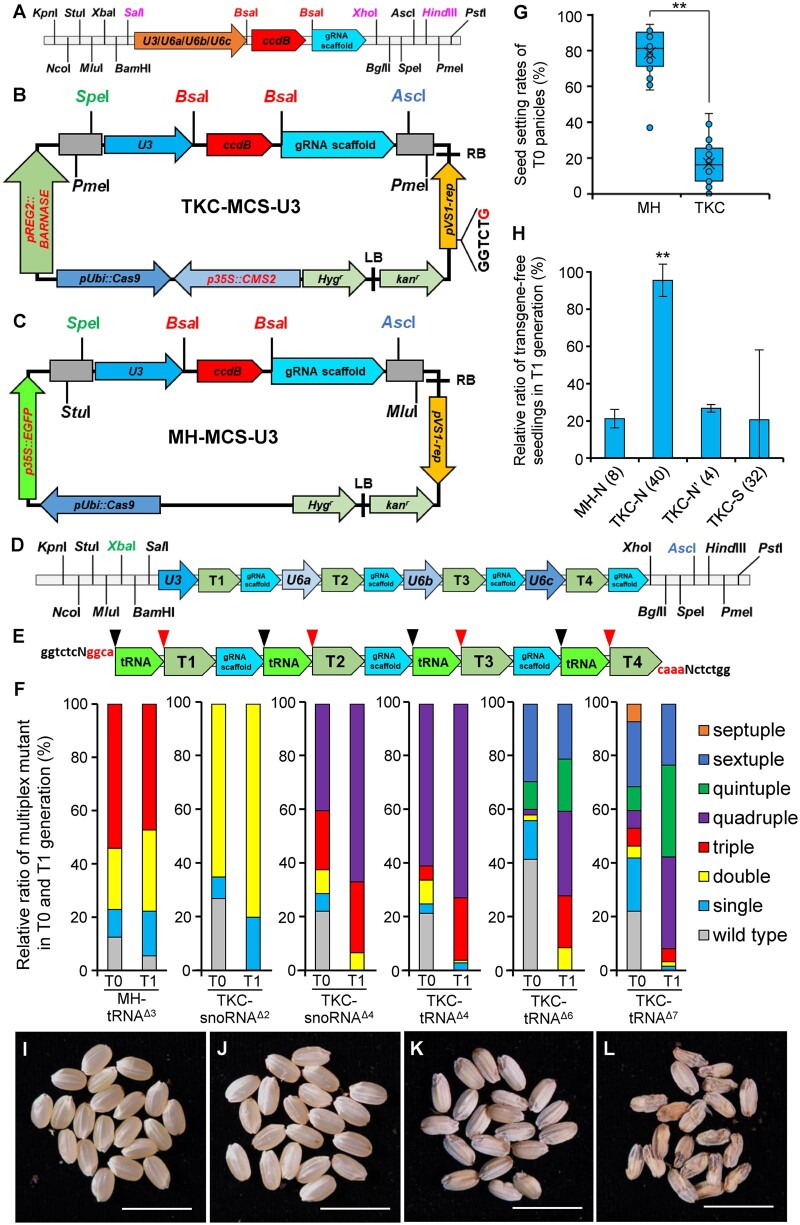
Figure 1.
The CASE toolkit for the creation of transgene-free multiplex null mutants in rice. A, The schematic diagram of cassettes of four gRNA cloning vectors (a commercial pMV vector, BGI Genomics, Beijing) containing rice snoRNA promoters of either U3, U6a, U6b, or U6c. Recognition sites of BsaI, flanking the ccdB gene, were used for the gRNA one-step assembly. Recognition sites in magenta words can be used to generate gRNA cassette combinations. ccdB, the ccdB lethal gene. B, The schematic diagram of the TKC-MCS-U3 backbone vector, modified from He et al. (2018). LB and RB, the left and right borders of the T-DNA. Hygr, hygromycin B-resistant gene. p35S::CMS2, rice CMS2 expressed under CaMV 35S promoter. pUbi::Cas9, Cas9 expressed under maize (Zea mays) Ubiquitin promoter. pREG2::BARNASE, bacterial BARNASE expressed under the Rice Embryo Globulin 2 promoter. The red “G” in pVS1-rep cassette represents a C-to-G substitution to eliminate the BsaI site. Kanr, kanamycin-resistant gene. C, The schematic diagram of the control MH-MCS-U3 backbone vector, modified from Ma et al. (2015), in which an enhanced Green Fluorescence Protein (eGFP) expressed under CaMV 35S promoter and a U3-driven gRNA expression cassette was added. D, A gRNA cassette series using snoRNA promoters of U3, U6a, U6b, and U6c, which were assembled from cassettes of gRNA cloning vectors shown in (A). XbaI and AscI were used in the following assembly of the gRNA cassette series to TKC-MCS-U3. T1, T2, T3, and T4 represent independent gRNAs. E, A chemically synthesized gRNA cassette containing four gRNAs spaced with tRNA. BsaI recognizes “ggtctc” (black) at both ends of the cassette, and produces “ggca” and “caaa” (red) sticky ends that will be used to deliver the gRNA cassette to TKC-MCS-U3 in one-step cloning. Black and red arrowheads marked the cleavage sites of RNases P and Z, respectively, at both ends of tRNAs. T1, T2, T3, and T4 represent individual gRNA. F, Analysis of multiplex gene-editing events generated using MH-tRNAΔ3, TKC-snoRNAΔ2, TKC-snoRNAΔ4, TKC-tRNAΔ4, TKC-tRNAΔ6, or TKC-tRNAΔ7 after Sanger sequencing. For T0 generation, all transgenic seedlings were analyzed, and for T1 generation, seedlings germinated from normal-looking seeds (TKC-N for TKC-MCS-U3 vectors, shown in (H)) were randomly selected. All decoding results of T1 generation are shown in Supplemental Table S4. G, Box plot diagrams showing the seed setting rates of T0 transgenic plants generated using MH-MCS-U3- and TKC-MCS-U3-based constructs. Upper and lower limits, center line, upper and lower quartiles indicate maximum and minimum, median, first, and third values, respectively. Asterisks indicate significant differences between samples, n = 28 (two-tailed Student’s t test, **P ˂ 0.01). H, Frequencies of transgene-free in T1 seedlings generated using MH-MCS-U3- and TKC-MCS-U3-based constructs. MH-N indicates T1 seedlings germinated from normal-looking seeds (see (I)) in MH-MCS-U3-based gene editing. TKC-N/Nʹ and TKC-S indicate T1 seedlings germinated from normal-looking (see (J)) and shrunken seeds (see (K)) from TKC-MCS-U3-based gene editing, respectively. Note that four TKC-Nʹ lines showed an unexpected low transgene-free ratio. Numbers (n) in brackets indicate numbers of independent T0 lines. Primers used for transgene detection are listed in Supplemental Table S1. Group data were expressed as means ± Standard deviation (sd) (two-tailed Student’s t test, **P ˂ 0.01 compared with the MH-N (8)). I–L, T1 seeds from MH-MCS-U3-based gene editing are normal-looking (I), whereas those from TKC-MCS-U3-based consisted of three types: normal-looking (J), shrunken (K), and aborted (L). Bar = 1 cm.

