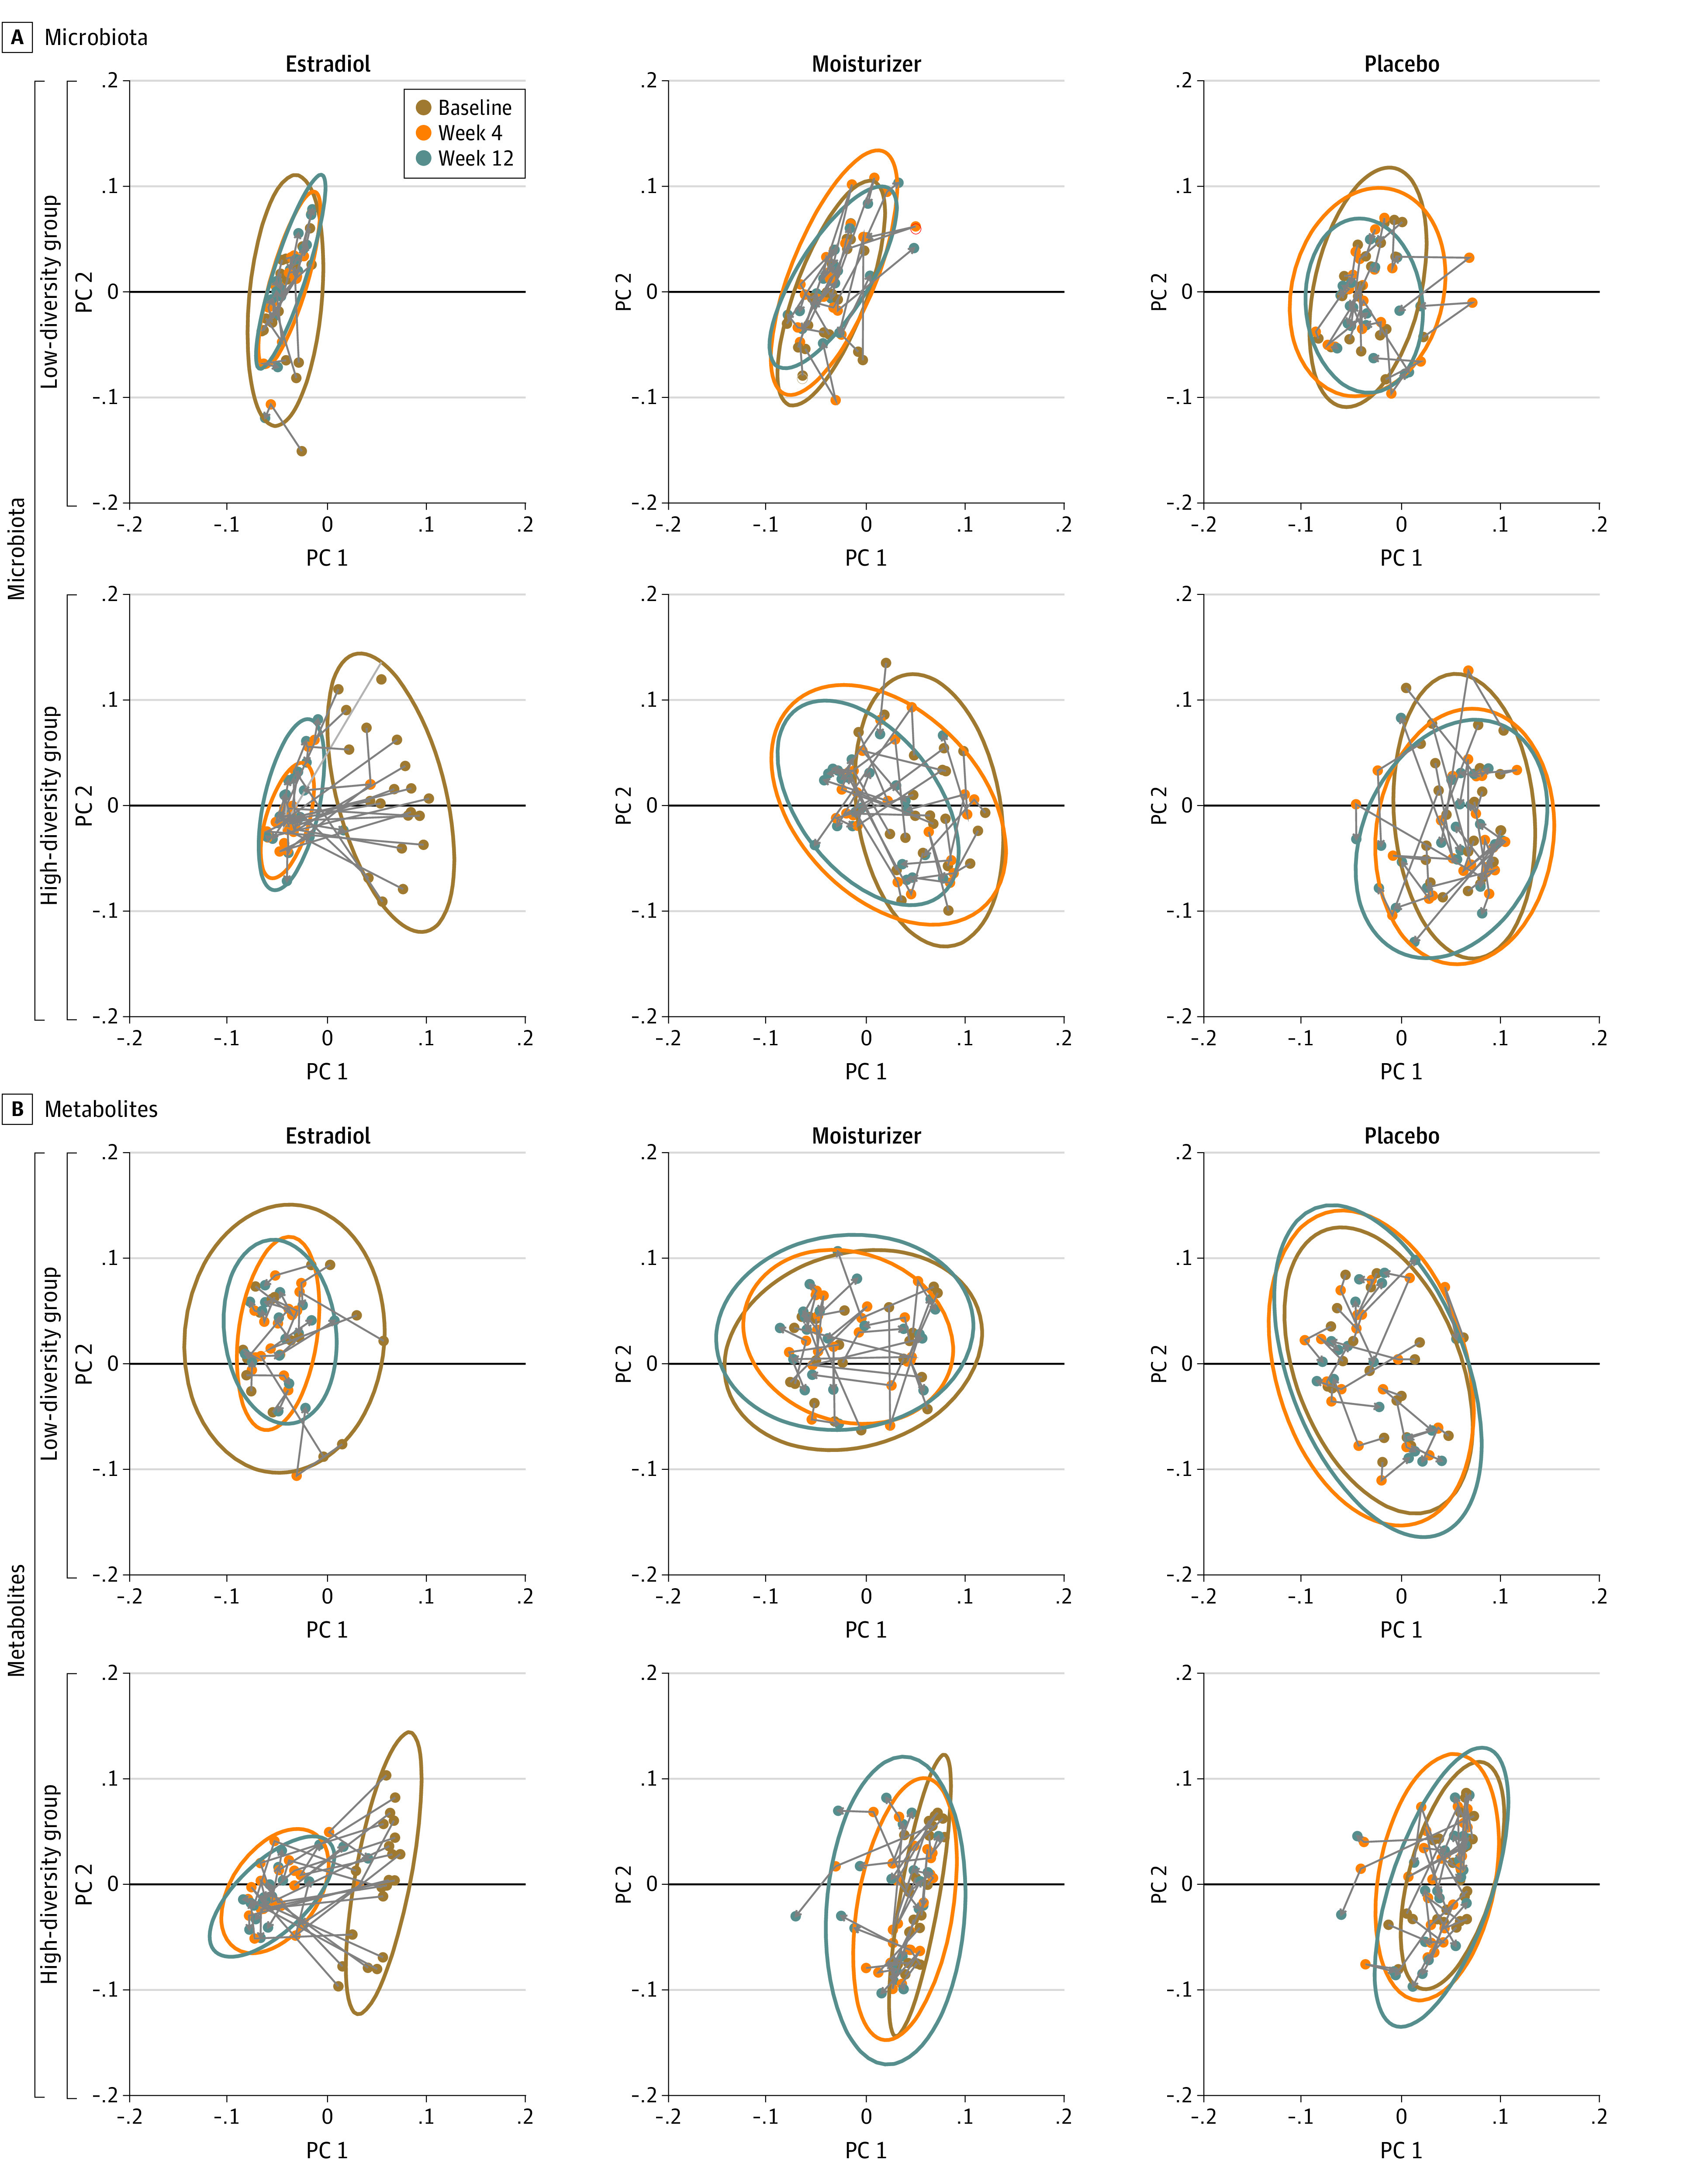
Figure 4. Metabolite and Microbiota Shifts Among Women in the High- and Low-Diversity Subgroups.

Each dot represents the vaginal bacterial community (A) or metabolic profile (B) in a single study participant and by time in study. PC indicates principal coordinates.
