Figure 2.

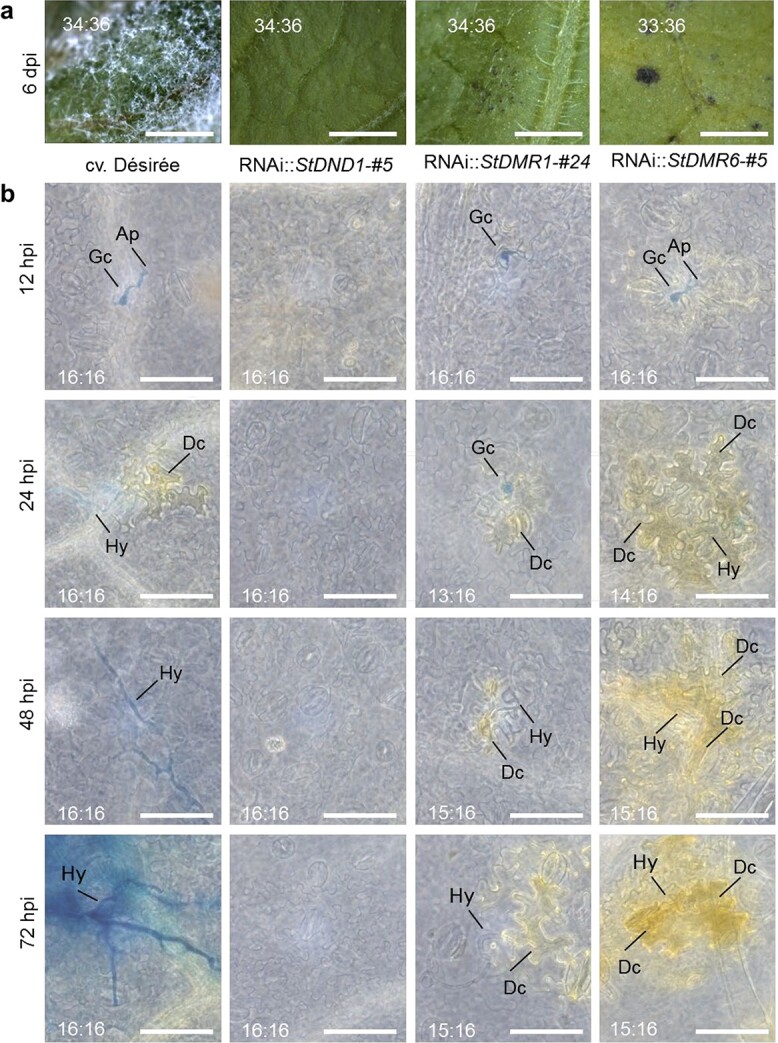
S-gene silencing in potato hampers P. infestans at different infection stages. a Disease symptoms on leaves of cv. ‘Désirée’ and S-gene silenced plants after inoculation with the P. infestans GUS-transformant EY6. Each image represents a single inoculation site at 6 dpi. The numbers in each image represent the ratio of inoculated sites with similar symptoms to the total number of inoculated sites in two independent experiments. Scale bars represent 5 mm. b Microscopic images of GUS-stained infection sites after inoculation with P. infestans EY6. The numbers in each image represent the ratio of inoculated sites with similar responses to the total number of inoculated sites in two independent experiments. Scale bars represent 100 μm. Ap, appressoria; Gc, germinated cyst; Hy, hypha; Dc, dead cell. Similar results were obtained with another set of RNAi lines (RNAi::StDND1-#17, RNAi::StDMR1-#47, RNAi::StDMR6-#6).
