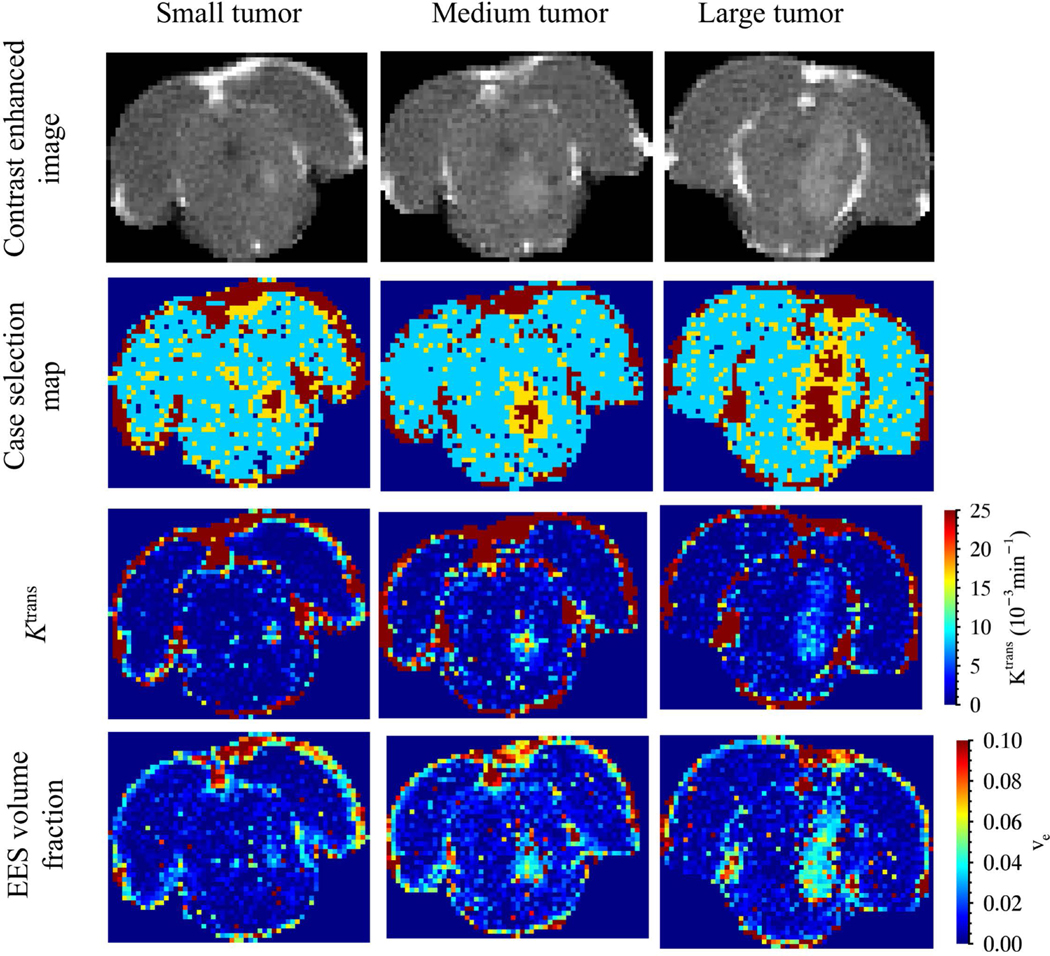
Figure 5:

Results of tracer kinetic analysis from rats with small (day 3), medium (day 10) and large (day 10) tumors representative of those in the study cohort. (First row) Contrast enhanced image at peak signal enhancement inside the tumor (roughly within 5–10 minutes after injection of the contrast agent). (Second row) Case selection map with dark blue for case 1, turquoise for case 2, yellow for case 3 and dark red for case 4. (Third row) map and (Fourth row) map of EES volume fraction
