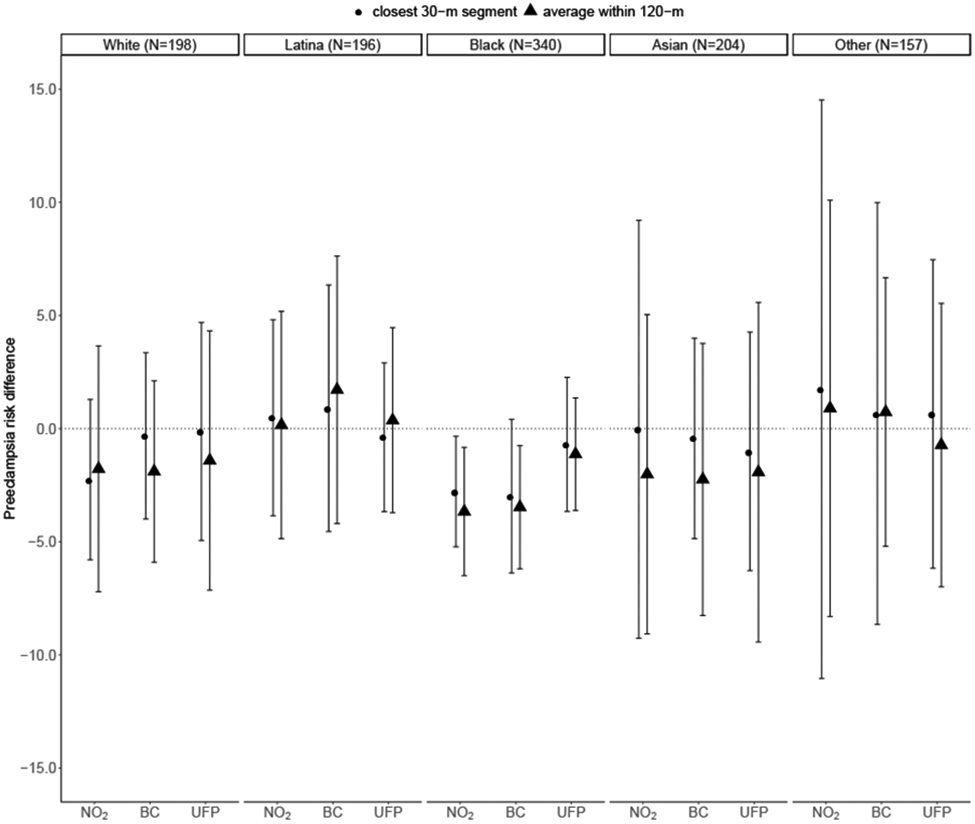
Figure 4. Estimated preeclampsia risk differences per 100 women and 95% CI by race/ethnicity associated with hypothetical intervention reducing the pollutant levels to the 25th percentile versus the observed levels by exposure characterization distance.

Note: Estimates shown for each pollutant averaged within 120-m and within 30-m of maternal residence at delivery. Models adjusted for maternal insurance type, age at delivery, age-squared, smoking history, parity, season of conception, proportion of census block with educational attainment less than high school, proportion of census block living below the poverty line. The 25th percentile was 9.0 ppb for NO2, 0.27 μg/m3 for BC, and 26.6 # × 103/cm3 for UFP.
