
Figure 6.
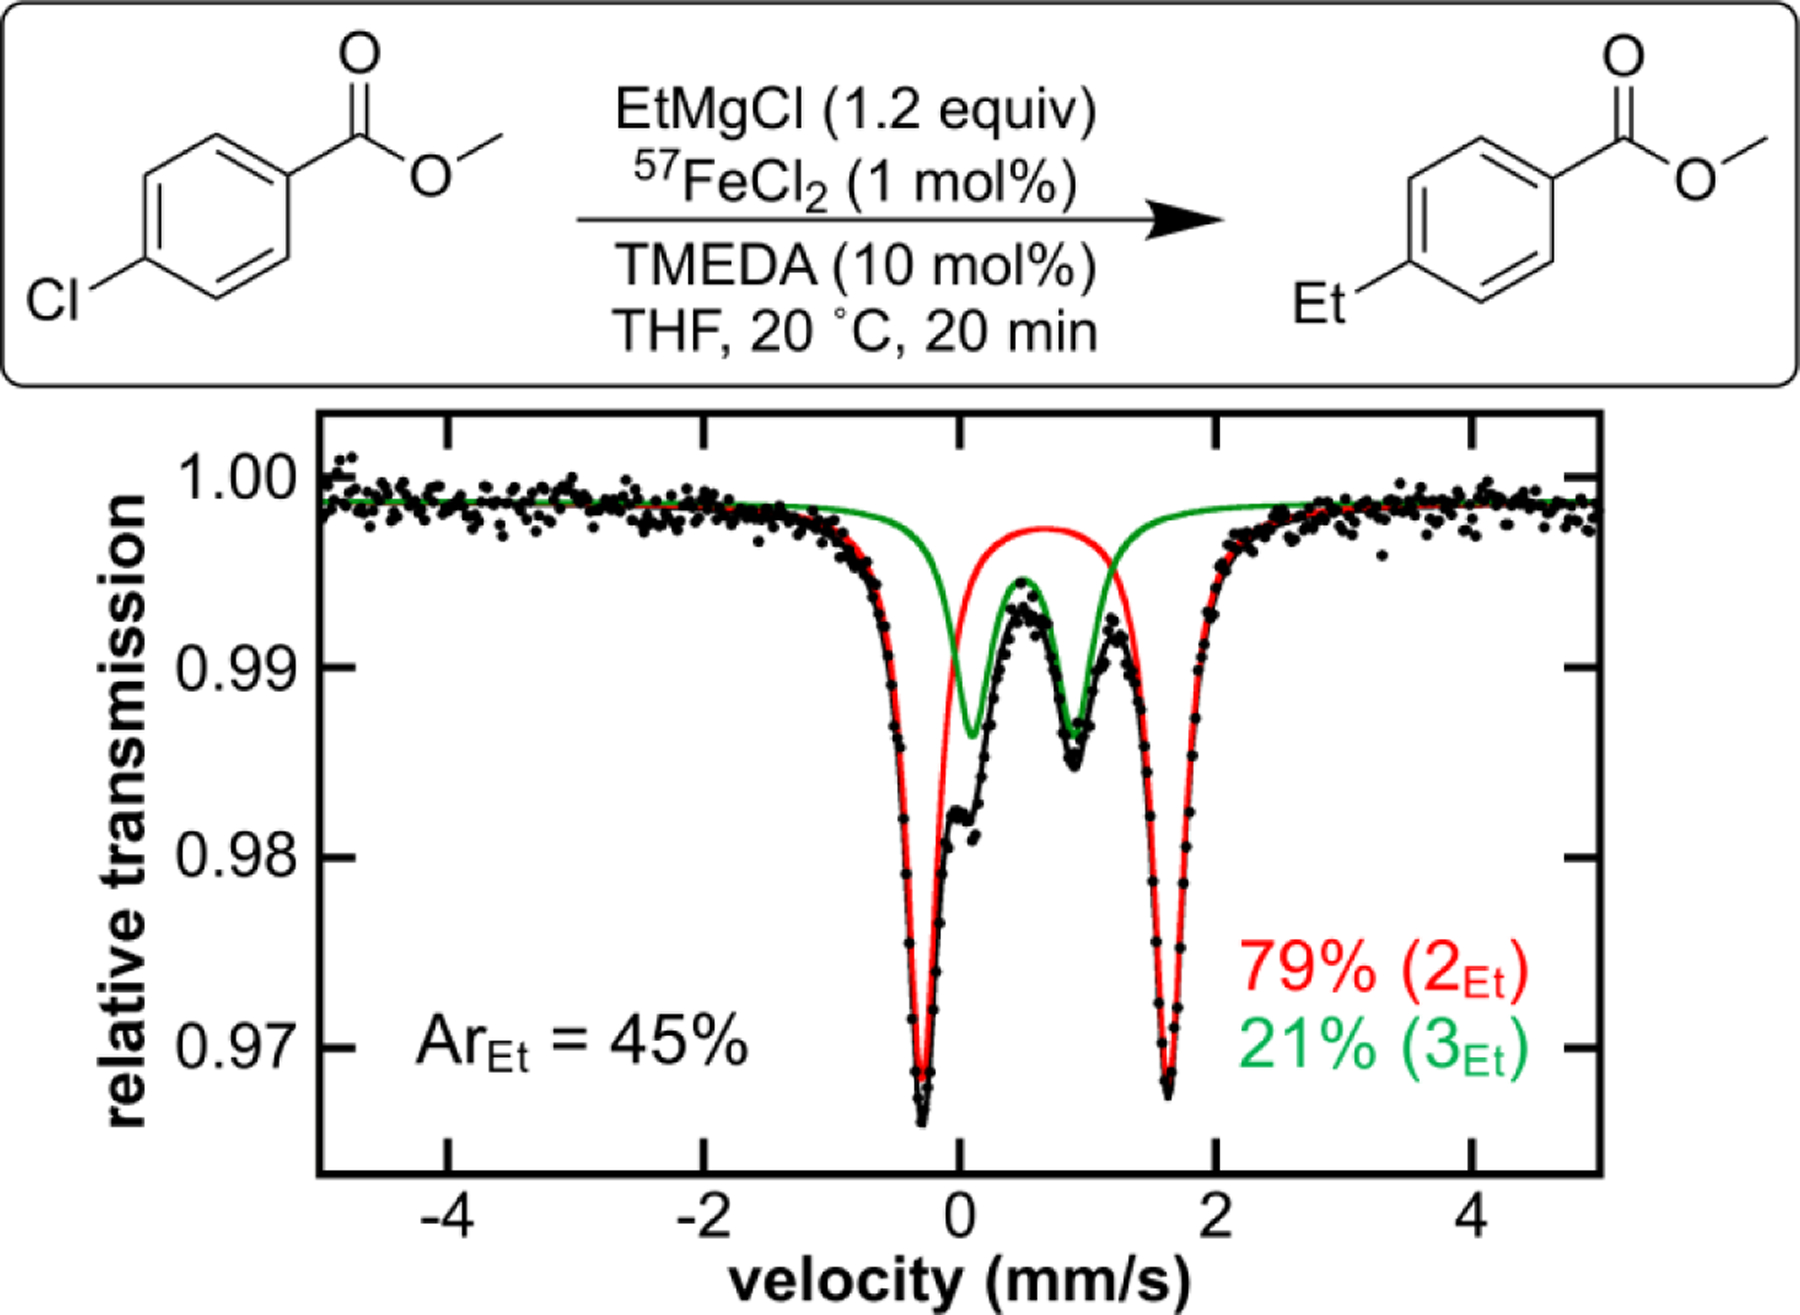
Freeze-trapped 80 K Mössbauer spectrum of Fox catalysis at 20 min (ca. halfway through catalysis); raw data (black dots), total fit (black trace), individual fit components are shown.
Official websites use .gov
A
.gov website belongs to an official
government organization in the United States.
Secure .gov websites use HTTPS
A lock (
) or https:// means you've safely
connected to the .gov website. Share sensitive
information only on official, secure websites.
Freeze-trapped 80 K Mössbauer spectrum of Fox catalysis at 20 min (ca. halfway through catalysis); raw data (black dots), total fit (black trace), individual fit components are shown.