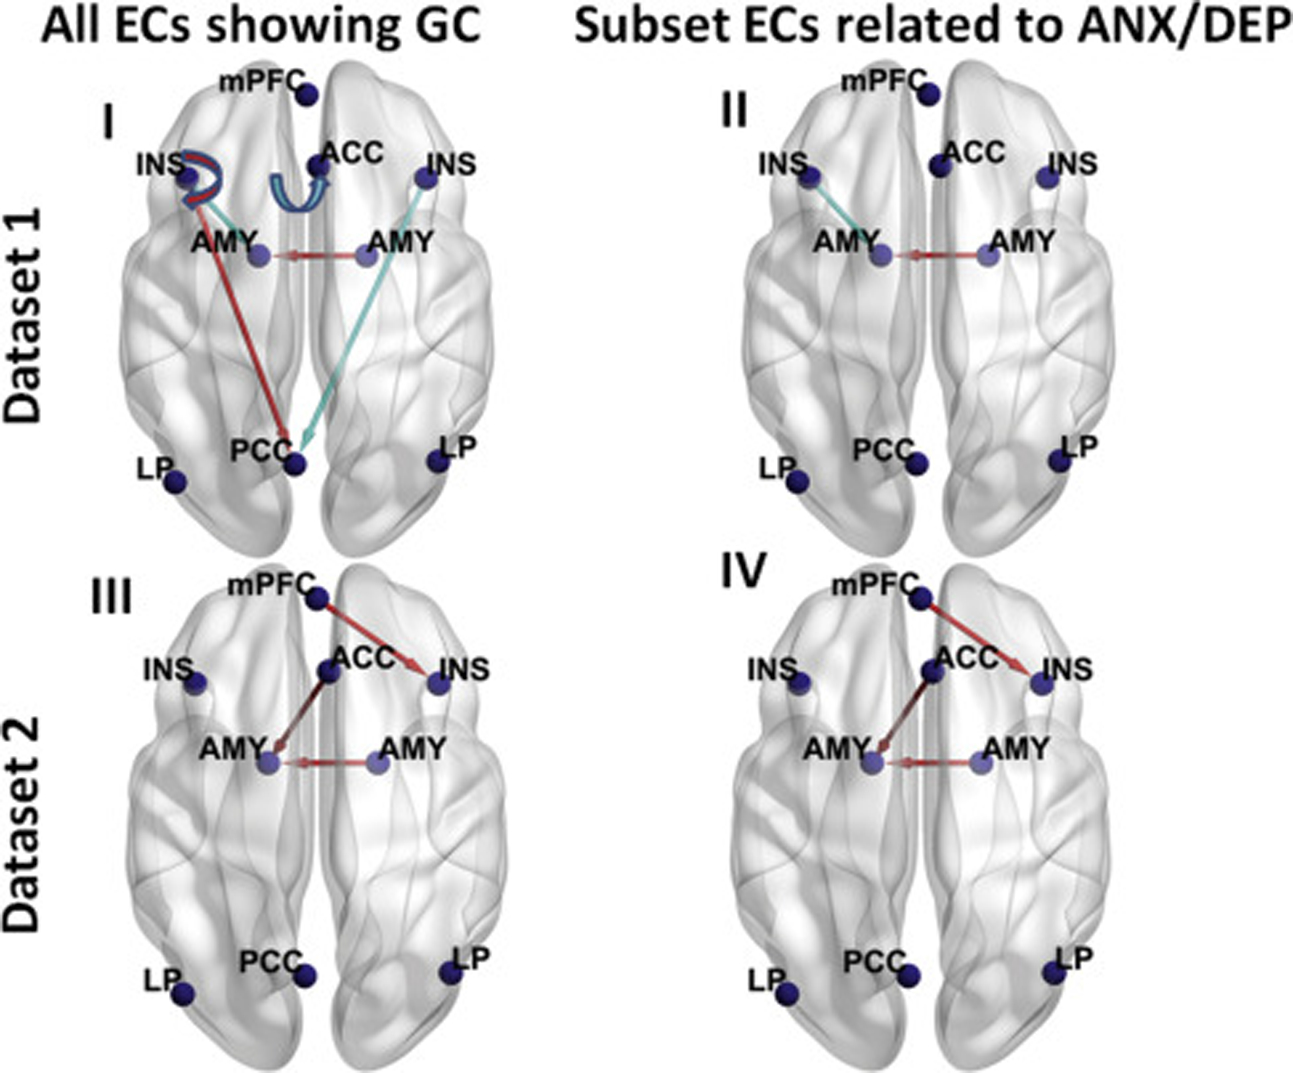
Figure 2.

Lines with arrows representing the group difference (GC) (cannabis use [CU] minus control) in effective connectivities (ECs) in dataset 1 (n = 28 for CU group and n = 28 for control group) (top panels) and dataset 2 (n = 21 for CU group and n = 21 for control group) (bottom panels), visualized with the BrainNet Viewer (http://www.nitrc.org/projects/bnv/) (72). For each dataset, all ECs showing group differences are shown in the left panels, and subset ECs showing group differences that are linearly related to at least 1 of the 3 negative affect z scores (anxiety [ANX], depression [DEP], and composite ANX/DEP z scores) are shown in the right panels. A semicircular line with arrow denotes self-connection. A red line denotes that this EC was greater in the CU group than the control group, and a light blue line denotes that this EC was smaller in the CU group than the control group. The Montreal Neurological Institute coordinates (mm) of the 9 dynamic causal modeling nodes are as follows: medial prefrontal cortex (mPFC) (−2, 54, −4), posterior cingulate cortex (PCC) (−4, −64, 22), left lateral parietal (LP) (−43, −75, 26), right LP (47, −69, 26), anterior cingulate cortex (ACC) (4, 30, 28), left insula (INS) (−36, 22, 2), right insula (INS) (36, 20, 6), left amygdala (AMY) (−23, −2, −20), and right AMY (20, 0, −20). The left side in the figure represents the left hemisphere of the brain, and the right side represents the right hemisphere of the brain.
