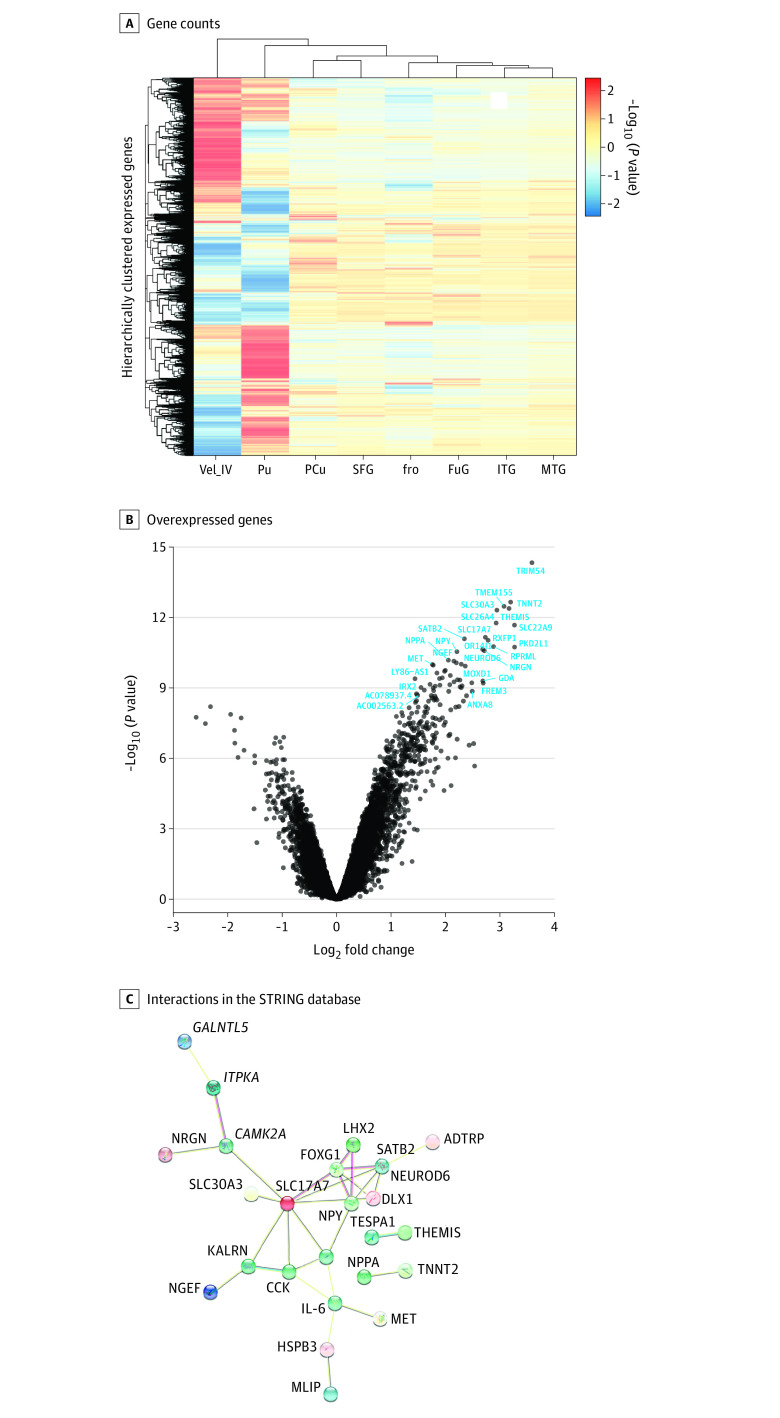
Figure 4. Genes Differentially Overexpressed in the Middle Temporal Gyrus (MTG) and Interleukin 6.
A, z Score normalized mean gene counts in each region of interest show little within-region variation within genes expressed in the MTG compared with other regions, particularly compared with the cerebellar regions, which show pronounced variation compared with the whole brain. Each row represents one gene’s expression. B, Compared with the whole brain (mean non-MTG values), 47 genes were highly overexpressed (false discovery rate–corrected P < .05; log-fold change >2) in the MTG specifically. C, Protein products of these genes plus interleukin 6 were highly enriched for interactions (connectivity P = 4.54 × 10⁻⁹) compared with the frequency of interactions in the STRING database, as measured in the sum of unweighted degrees in the network. Edge colors represent different evidence underlying predicted protein-protein interactions in the STRING database. Images within spheres represent known protein structures; node color is aesthetic. fro Indicates operculum; FuG, fusiform gyrus; ITG, inferior temporal gyrus; MTG, middle temporal gyrus; PCu, precuneus; Pu, putamen; SFG, superior frontal gyrus; Vel_IV, cerebellar vermis.

