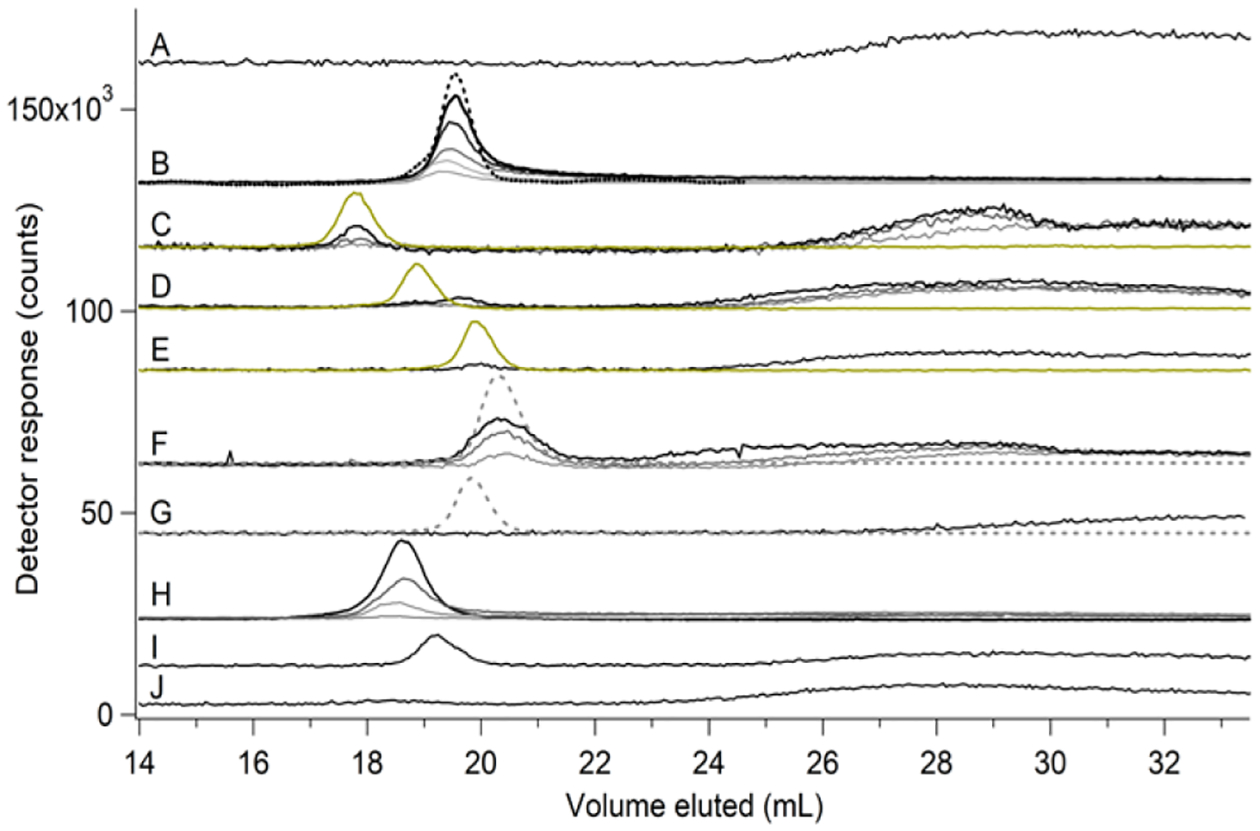
Figure 4. Chromatographic behavior of nickel standards.

Ni-, S-, and P-detected traces are black, yellow, and grey-dashed lines, respectively, for solutions of 2 μM NiSO4 and the following ligands in mobile phase buffer (all final concentrations): (A), nothing (×10); (B), histidine (from lightest to darkest) at 25, 50, 100, 500, and 1000 μM (×2); the black-dashed line is Abs at 210 nm (×600); (C), GSSG at 1 mM (light), 5 mM (darker) with S trace (×0.25), and 10 mM (darkest) (×5); (D), GSH at 1 mM (light), 5 mM (darker) with S trace (×0.5), and 20 mM (darkest) (×5); (E), cysteine at 5 mM with S trace (×0.5) (×5); (F), ATP at 1 mM (light), 5 mM (darker) with P trace (dashed, ×0.015), and 10 mM (darkest) (×5); (G), KH2PO4 at 500 μM with P trace (dashed, ×0.025) (×5); (H), citrate (from lightest to darkest) at 100, 500, 1000, and 5000 μM; (I), aspartate at 5 mM (×5); and (J), glutamate at 5 mM (×5).
