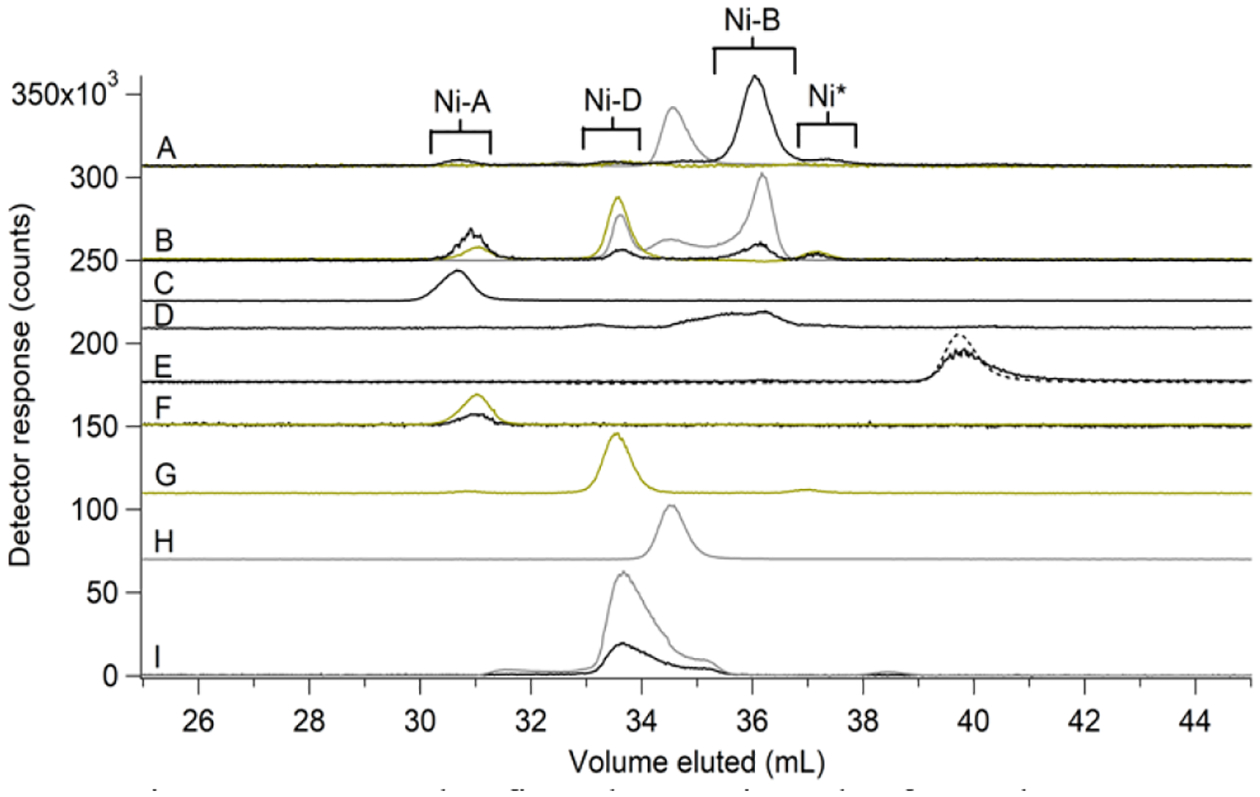
Figure 6. SEC-ICP-MS (double column) chromatograms of FTS, pFTS, and standards.

(A), FTS; (B), pFTS; (C-I), standards. (A), Ni (black, ×3), S (yellow, ×3), and P (grey, ×0.25). Brackets indicate Ni-containing fractions collected for ESI-MS analysis. Ni* represents an unassigned Ni-containing peak. (B), Ni (×3), S, and P (×0.05) traces for 2 μM NiSO4 added to the pFTS; (C) – (I), 2 μM NiSO4 plus: (C), 2 mM citrate; (D), 5 mM Asp (×5); (E), 1 mM His (×3). Green dashed line is Abs at 210 nm (×25); (F), 5 mM GSSG (×10) with S trace (×0.25); 0 μM NiSO4 plus: (G), S trace of 5 mM GSH; (H), P trace of 500 μM NaH2PO4 (×0.5); 2 μM NiSO4 plus: (I), 5 mM ATP (×5) with P trace (×0.05).
