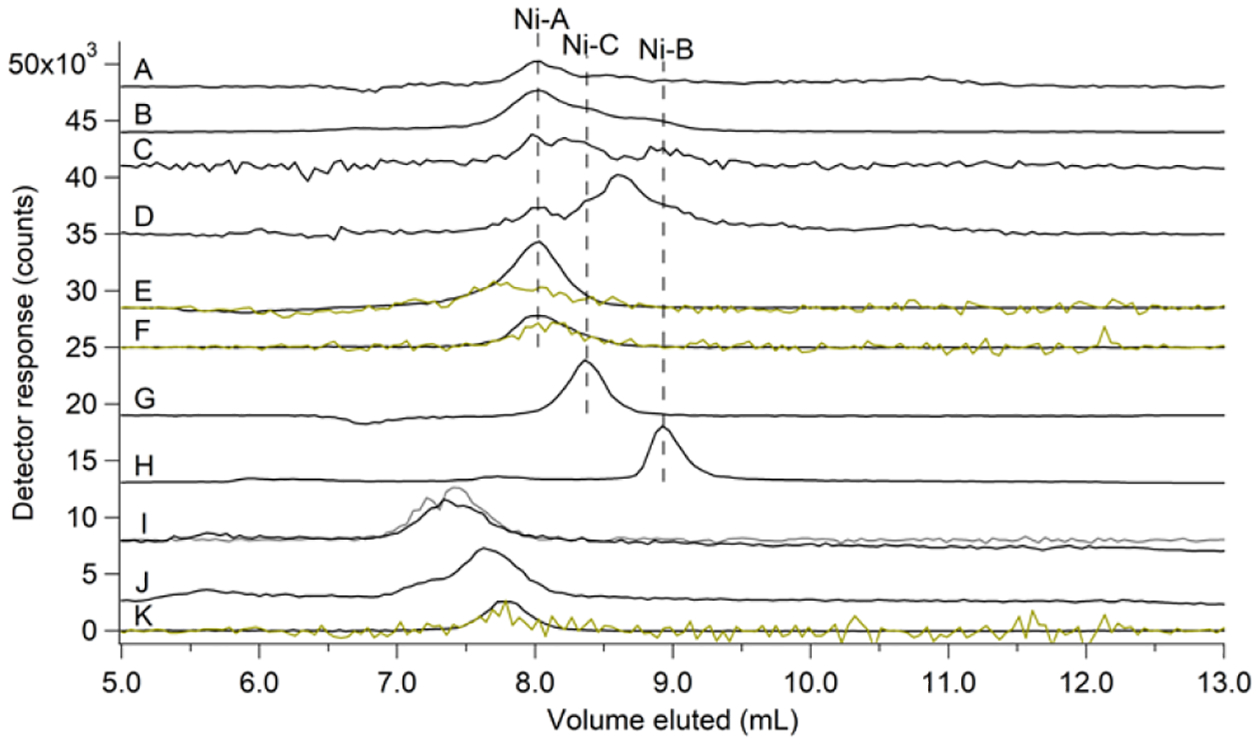
Figure 7. HILIC-ICP-MS chromatograms of FTS and standards.

Ni (black) traces for: (A), average of 7 FTS replicates isolated from aerobically-grown cells (×10); (B), average of 2 lyophilized FTS replicates isolated from aerobically-grown cells; (C), average of 3 FTS replicates isolated from anaerobically-grown cells (×10); (D), average of 3 FTS replicates isolated from anaerobically-grown cells supplemented with 1 μM NiSO4 + 400 μM histidine in the growth media (×10); (E), pFTS (×0.5) with S (yellow, ×5); (F – L), Ni(II) standards composed of 1 μM NiSO4 plus the following ligands (all final concentrations): (F), 2 mM GSSG with S (yellow, ×5); (G), 1 mM His; (H), 2 mM Asp (×2); (I), 1 mM ATP (×3) with P (grey, ×0.25) trace; (J), 2 mM citrate (×2); and (K), 2 mM GSH with S (yellow, ×10). Dashed black lines represent position of nickel species according to standard comigration.
