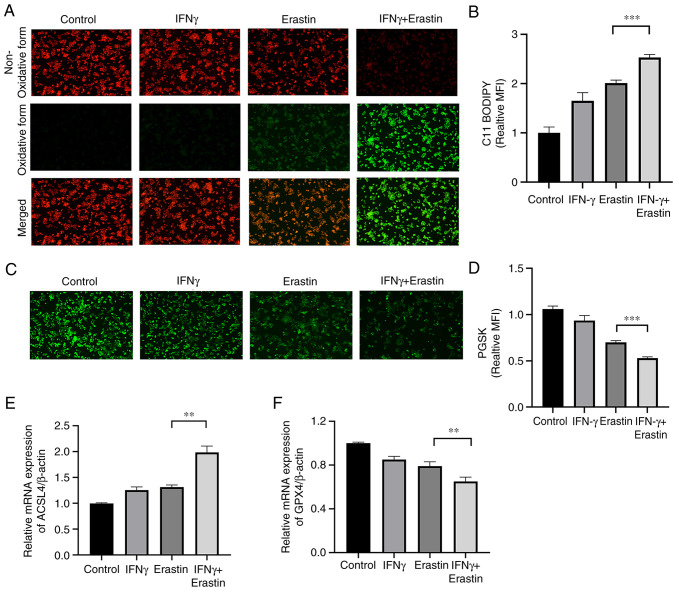
Figure 3.
IFNγ enhances erastin-induced ferroptosis. (A) Lipid peroxidation was assessed by C11-BODIPY; red fluorescence represents the non-oxidized form, while green fluorescence represents the oxidized form (magnification, ×100). (B) Bar graph presenting the green MFI from A (n=3). (C) Representative images of PGSK staining obtained by a fluorescence microscope (magnification, ×100). (D) Bar graph displaying the relative iron content (n=3). (E and F) Reverse transcription-quantitative PCR analysis of the expression of ACSL4 and GPX4 (n=3). Values are expressed as the mean ± standard deviation (**P<0.01 and ***P<0.001). PGSK, Phen Green SK; ACSL4, acyl-CoA synthase long chain family member 4; MFI, mean fluorescence intensity; GPX4, glutathione peroxidase.

