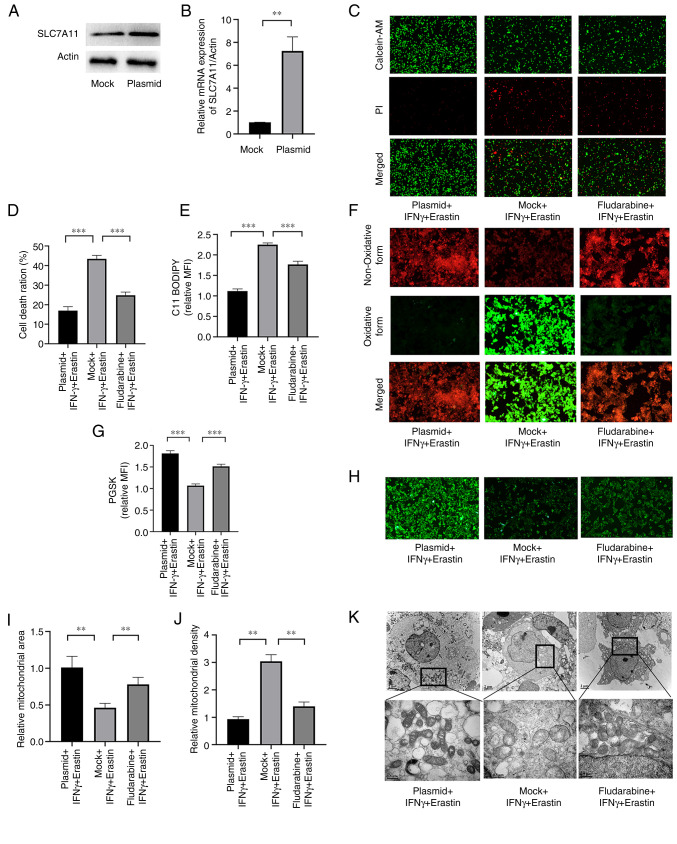
Figure 6.
SLC7A11 overexpression or STAT1 suppression ameliorate IFNγ-enhanced erastin-induced ferroptosis. (A) Western blot analysis of SLC7A11 in mock and plasmid groups. (B) Reverse transcription-quantitative PCR analysis was performed to measure the mRNA expression of SLC7A11 in the mock and plasmid groups. (C) Representative images of the Live/Dead cell analysis and (D) quantification of the results. (E) Quantitative results for C11-BODIPY fluorescence and (F) representative images (magnification, ×200). (G) Quantitative PGSK fluorescence and (H) representative images (magnification, ×100). (I) Mitochondrial area and (J) mitochondrial density determined from transmission electron microscopy images by using the ImageJ software; (K) representative transmission electron microscopy images. Scale bars, 2 µm for the first row; 0.5 µm for the magnified images. Values are expressed as the mean ± standard deviation (**P<0.01 and ***P<0.001). PGSK, Phen Green SK; MFI, mean fluorescence intensity; PI, propidium iodide; AM, acetoxymethyl ester; SLC7A11, solute carrier family 7 member 11.

