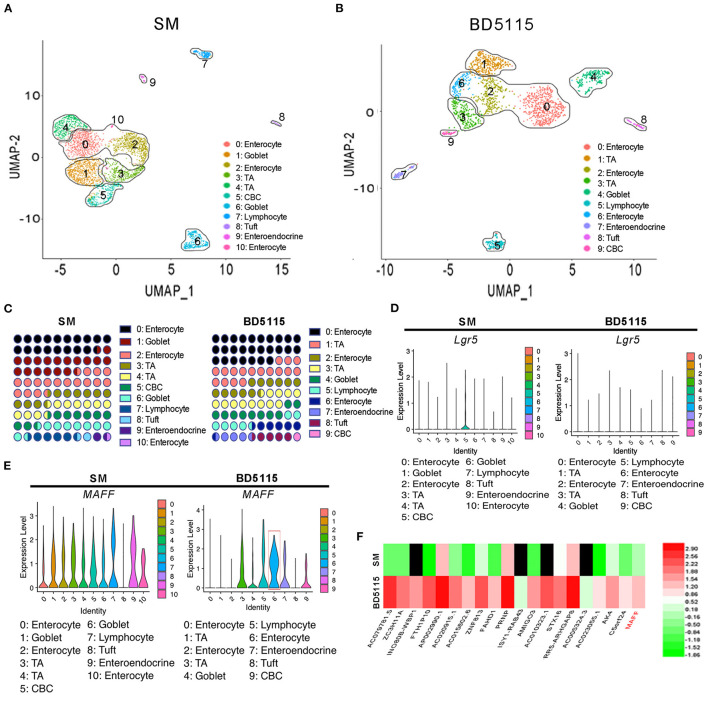
Figure 3.
Single-cell RNA sequencing of colon tissues. UMAP analyses of colon tissues (n = 5 for biologically independent BD5115 animals vs. n = 5 for SM animals) from the SM group and BD5115 group are shown in (A,B), respectively. UMAP clustering of all cells in the BD5115 and SM group after integration. Each color represent cells with a different sub-identity. (C) The proportions of different cell types in the colon tissues of mice in the SM group and BD5115 group. (D) LGR5 gene expression in the SM group and BD5115 group. (E) MAFF gene expression in the SM group and BD5115 group. (F) Heatmap showing the DEGs in Caco-2 cells treated with BD5115 metabolites.

