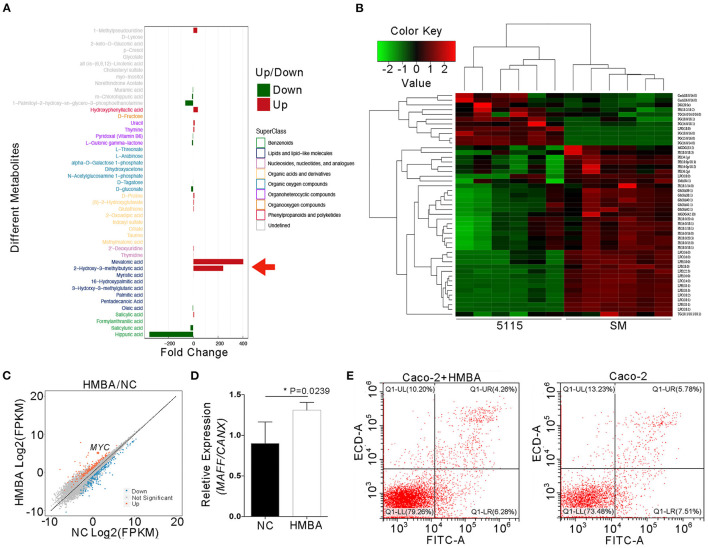
Figure 5.
Identification of the active components of BD5115 metabolites. (A) The differences in BD5115 metabolites and skimmed milk as determined by metabonomics analysis. The red arrow represents the compound with significant increases in the BD5115 group. (B) Differences between BD5115 metabolites and skimmed milk in the liposome group. (C) Scatter plot of DEGs as determined by RNA sequencing. Caco-2 cells were treated with HMBA for 24 h, after which total RNA was extracted. (D) Verification of the MYC gene expression in Caco-2 cells treated with HMBA for 24 h by qPCR (n = 3 for biologically duplication, the data are presented as the mean ± SEM, * P < 0.05, Student's t-test). (E) The apoptosis of Caco-2 cells was analyzed by flow cytometry after MYC gene expression was increased.

