
FIGURE 9.
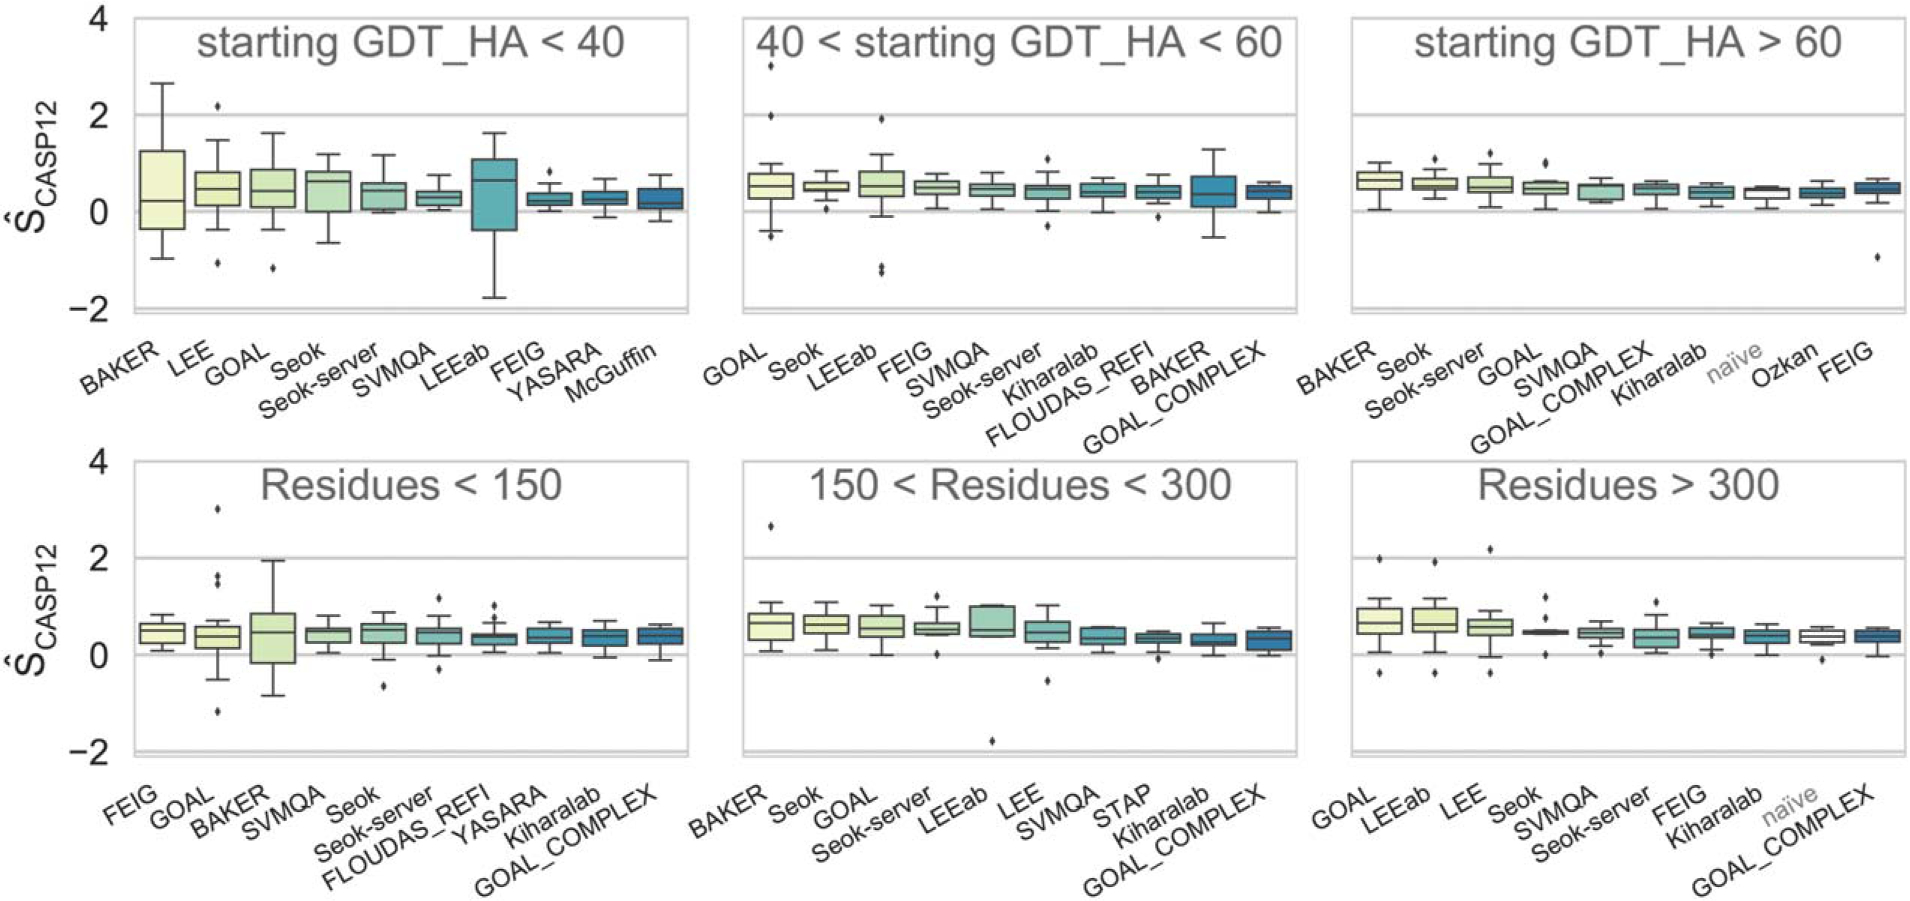
Overall performance by group as measured by the assessors score on the targets grouped into three bins based on the starting model’s GDT_HA (top row) and target size (lower row). Groups in each panel are ordered left-to-right by their rank (decreasing sum of over all targets). Only the first submitted models are considered