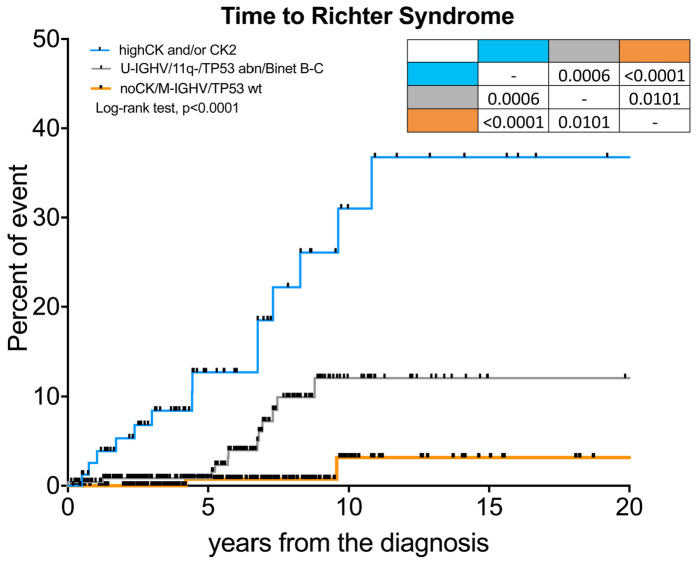
Figure 3.
The Richter syndrome scoring system. Kaplan-Meier curve of time to Richter syndrome transformation according to the Richter syndrome scoring system. Patients were classified at high-risk if they were high-CK and/or CK2 at CLL diagnosis (blue curve); at intermediate-risk if they displayed unmutated IGHV status (UIGHV), 11q22-23 deletion (11q), TP53 abnormalities (including deletions or mutations, TP53 abn) or Binet stage B-C (grey curve); at low-risk if they were IGHV mutated (M-IGHV) patients without CK and wild-type TP53 gene (TP53 not deleted non mutated) (orange curve).

