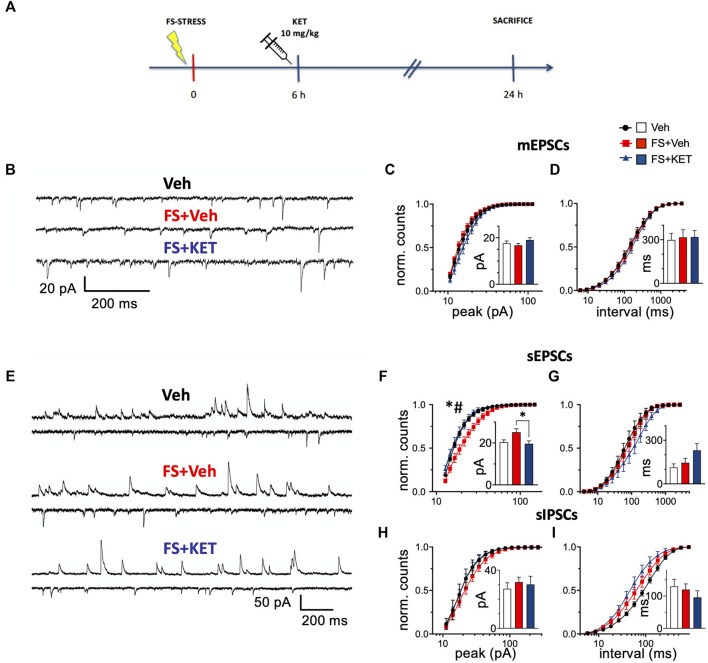
FIGURE 2.
Miniature and spontaneous synaptic transmission. (A) Experimental plan timeline. Rats were injected with saline (Veh), subjected to acute FS, and injected with saline 6 h after stress (FS + Veh) or subjected to acute FS and injected with ketamine 6 h after stress (FS + KET). All the animals were sacrificed 24 h after FS beginning. (B–D) Miniature excitatory PSCs [mEPSCs, tetrodotoxin (TTX) 1 μM, picrotoxin 0.1 mM, and strychnine 1 μM] recorded with patch-clamp in putative pyramidal neurons within PL-PFC layers II–III. (B) Representative traces from Veh (upper trace), FS + Veh (middle trace), and FS + KET (bottom trace) cells (−60 mV). Normalized binned cumulative distributions of mEPSC peak amplitudes (C) and inter-event intervals (D) averaged across Veh (14 cells), FS + Veh (11 cells), and FS + KET (9 cells). Bar graph insets: means of the average mEPSC peak amplitude (C) and inter-event interval (D). (E–I) Spontaneous excitatory and inhibitory PSCs (sEPSCs and sIPSCs respectively) PSCs. (E) Representative paired traces from Veh (top pair), FS + Veh (middle pair), and FS + KET (bottom pair) cells. In each pair, the upper and lower traces show sIPSCs (+3 mV) and sEPSCs (−58 mV), respectively. Normalized binned cumulative distributions of peak amplitudes (F,H) and inter-event intervals (G,I) of sEPSCs (F,G) and sIPSCs (H,I) averaged in Veh (sEPSCs: six cells; sIPSCs: five cells), FS + Veh (sEPSCs: six cells; sIPSCs: nine cells), and FS + KET (sEPSCs: seven cells; sIPSCs: eight cells). Bar graph insets: means of the average peak amplitude (F,H) and inter-event interval (G,I) of sEPSCs (F,G) and sIPSCs (H,I). All the data are expressed as means ± SEM (see main text for more details). Post-hoc tests: *p < 0.05, FS + Veh vs Veh; #p < 0.05, FS + KET vs FS + Veh.

