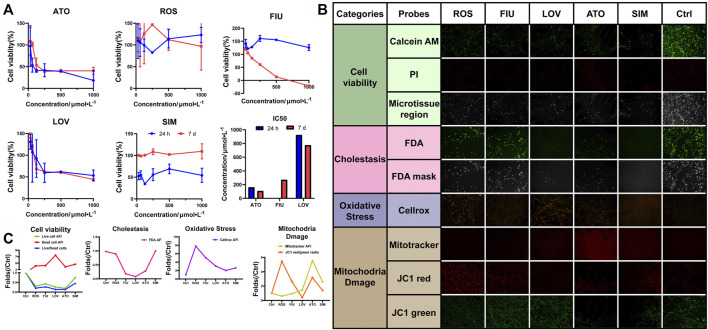
FIGURE 6.
Use of 3D-P co-culture system in the assessment of statin-induced hepatotoxicity. (A) Cytotoxicity and IC50 analyses of L-02 cells in the four co-culture systems with treatment of five statins (ATO: atorvastatin; ROS: rosuvastatin; FIU: fluvastatin; LOV: lovastatin; SIM: simvastatin; control: 0.1% DMSO). Multiparametric HCA assessments of 3D-P co-culture system at day 7 exposed to different statins for 24 h: ATO (100 μmol/L); ROS (100 μmol/L); FIU (300 μmol/L); LOV (1000 μmol/L); SIM (100 μmol/L). After incubation, seven fluorescence-based endpoints were measured to assess chemically induced alterations in cellular functions. (B) Representative confocal images shown correspond to each drug. (C) Image analysis readouts were derived from the analysis performed in 3D space. All values are presented as normalized relative to the control. The data are shown as the mean ± SD of triplicate experiments. Scale bar = 100 μm for B.

