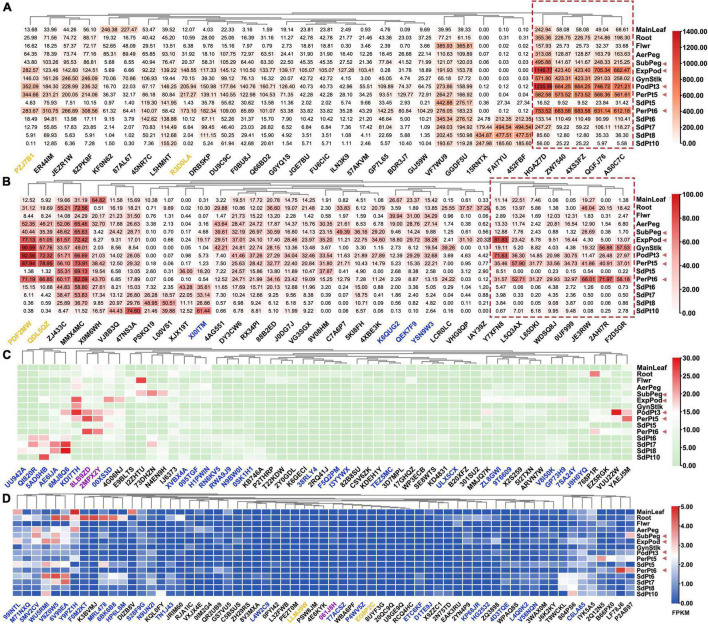
FIGURE 6.
Gene express patterns of 188 FcAP2/ERF genes in 15 samples in A. hypogaea cv. Tifrunner. Main leaf, main stem leaf; Root, roots of 10 days postemergence; Flwr, petals, keel, and hypanthium sepals; AerPeg, elongating aerial pegs; Subpeg, elongating subterranean pegs; GynStlk, Pattee 1 stalk of gynophore; PodPt3, Pattee 3 pod; PerPt5, Pattee 5 pericarp; SdPt5, Pattee 5 seed; PerPt6, Pattee 6 pericarp; SdPt6, Pattee 6 seed; SdPt7, Pattee 7 seed; SdPt8, Pattee 8 seed; SdPt10, Pattee 10 seed (Clevenger et al., 2016). Black gene ID: ERFs; blue gene ID: AP2; yellow gene ID: RAV; purple gene ID: Soloist. They were divided into the four groups, red dotted boxes indicated FcAP2/ERFs that might be involved in mechanical pressure signal transduction. The red triangle indicates the tissues that experience mechanical stress. (A) The maximum FPKM value was greater than 100; (B) The maximum FPKM value was between 30 and 100; (C) The maximum FPKM value was between 5 and 30; (D) The maximum FPKM value was less than 5.

