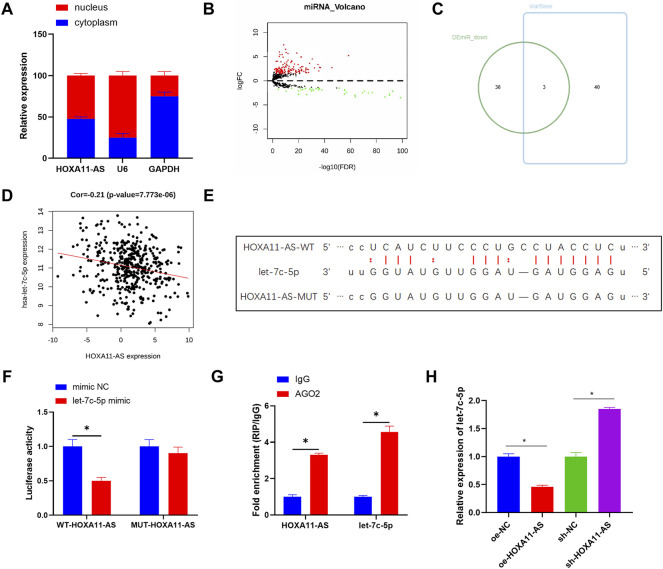
FIGURE 2.
HOXA11-AS sponges let-7c-5p. (A) Subcellular fractionation evaluated the expression of HOXA11-AS in nucleus and cytoplasm. (B) Differential analysis on miRNA in two groups was performed and the result was shown in the Volcano Plot, with red indicating upregulated genes and green indicating downregulated genes. (C) Venn diagram depicted the intersection of predicted target miRNAs and differentially downregulated miRNAs. (D) The scatter plot described the correlation between HOXA11-AS and let-7c-5p. (E) The binding sites between HOXA11-AS and let-7c-5p were predicted on starBase database. (F,G) The target binding of let-7c-5p to HOXA11-AS was demonstrated in RIP assay and dual-luciferase reporter detection. (H) Let-7c-5p expression in each group of cells after transfection was determined in qRT-PCR assay; *p < 0.05.

