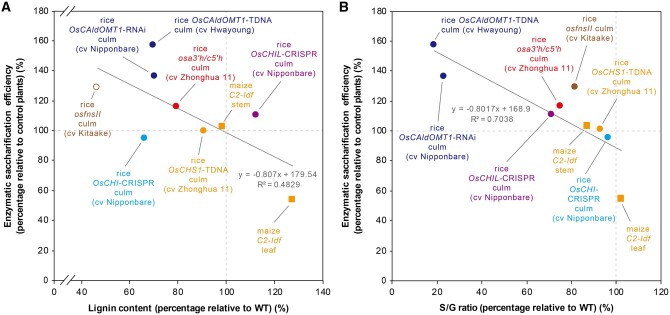
Figure 8.
Correlation analyses between changes in enzymatic saccharification efficiency and lignin content/composition of tricin-depleted grass mutant and transgenic plants. A, Correlation analysis between change in enzymatic saccharification efficiency (24-h digestion; without pretreatment) and change in lignin content. Lignin content was determined by Klason lignin assays (filled data points) or thioglycolic acid assay (empty data point). B, Correlation analysis between change in enzymatic saccharification efficiency (24-h digestion; without pretreatment) and change in S/G ratio. S/G ratio was determined by thioacidolysis. Data of rice osfnsII (Lam et al., 2017), osa3ʹh/c5ʹh (Lam et al., 2019a, 2019b), OsCAldOMT1-TDNA and OsCAldOMT1-TDNA (Lam et al., 2019a, 2019b), and maize C2-ldf (Eloy et al., 2017) were retrieved from the literature. The percentages relative to control plants were calculated by dividing the value of the mutant or transgenic plant by that of the corresponding control plant. Equations and R2 values of the best fit lines are shown. Species names, cultivars, plant line names, and tissues used for analysis are indicated. Circles: rice. Squares: maize. Data points of the mutants are labeled with different colors according to the gene mutated.

