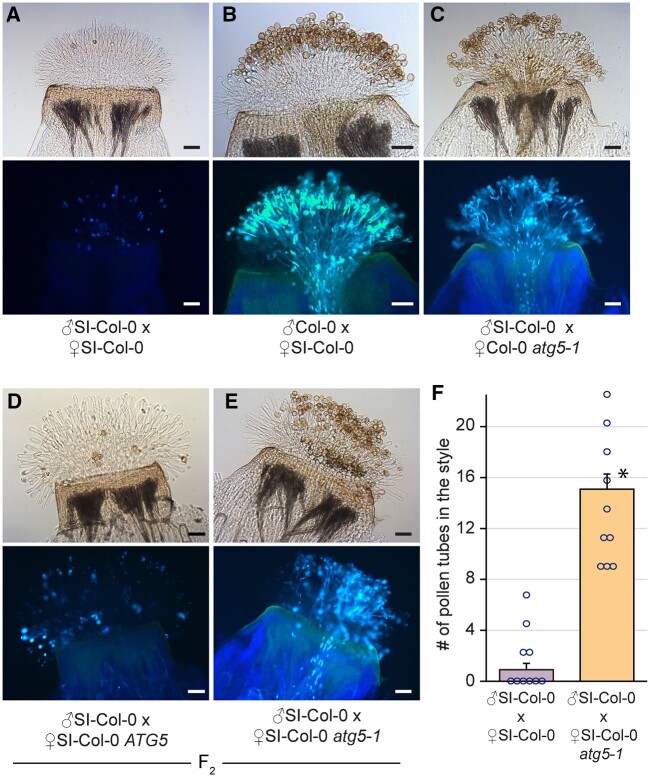
Figure 3.
Representative images of aniline blue-stained SI-Col-0 or SI-Col-0 atg5-1 pistils at 24 h following pollination. A–E, All stigmas were hand-pollinated with SI-Col-0 pollen or wild-type Col-0 pollen as indicated and collected at 24-h postpollination for aniline blue staining. The genotypes of the pistils are indicated for each panel. Pollen tubes penetrating through the stigma and style indicate a breakdown of self-incompatibility as seen in (E). For each panel, top image = brightfield, bottom image = aniline blue. Scale bar = 100 µm F, Bar graph showing the mean number of pollen tubes at 24 h postpollination. Data are shown as mean ± se with all data points displayed. n = 10 pistils per line. At 24 h, pistils from SI-Col-0 atg5-1 mutants allowed a significantly higher number of SI-Col-0 pollen tubes compared to the SI-Col-0 pistils (P < 0.05, Student’s t test).

