Figure 3.

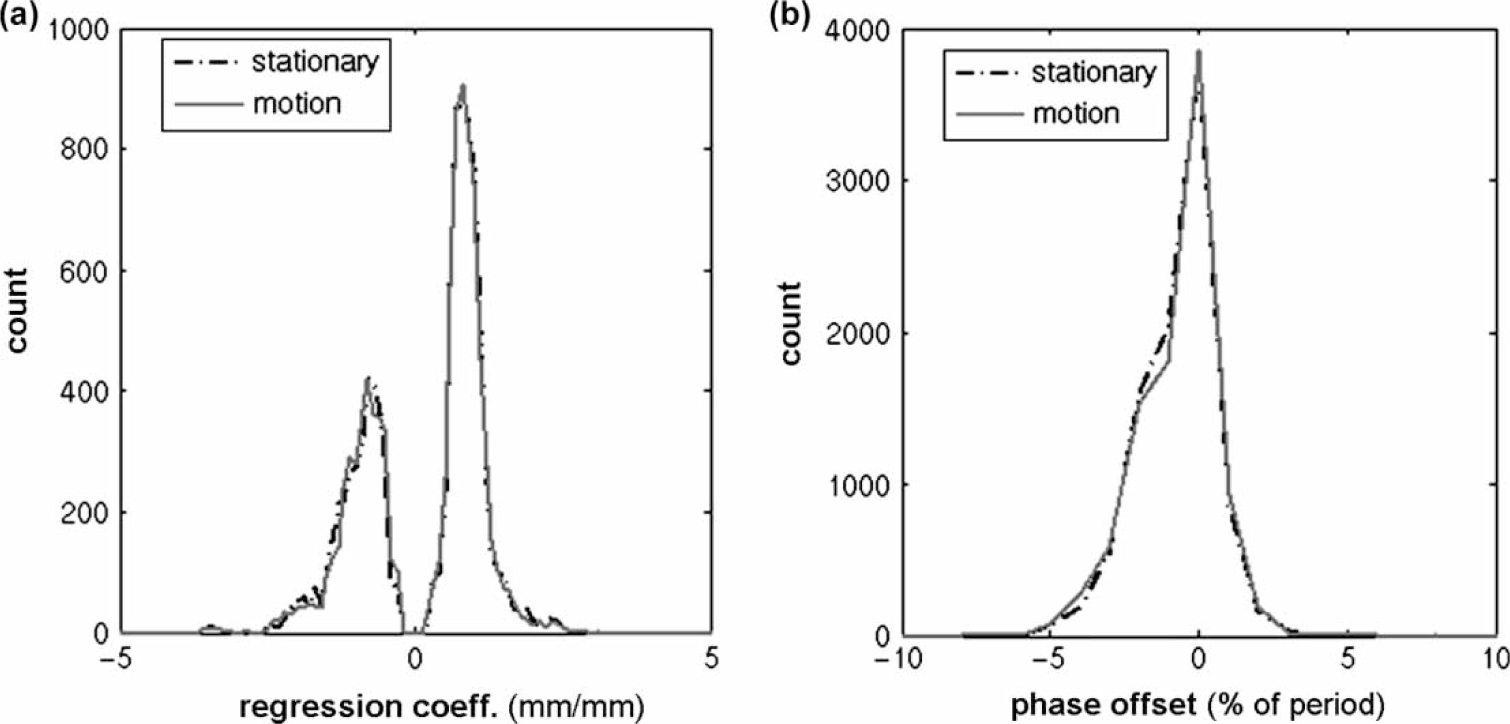
Histograms showing distributions of parameter values (a) regression coefficient and (b) phase offset used to characterize the relationship between pairs of markers while the couch is stationary and while the couch is in motion.

Histograms showing distributions of parameter values (a) regression coefficient and (b) phase offset used to characterize the relationship between pairs of markers while the couch is stationary and while the couch is in motion.