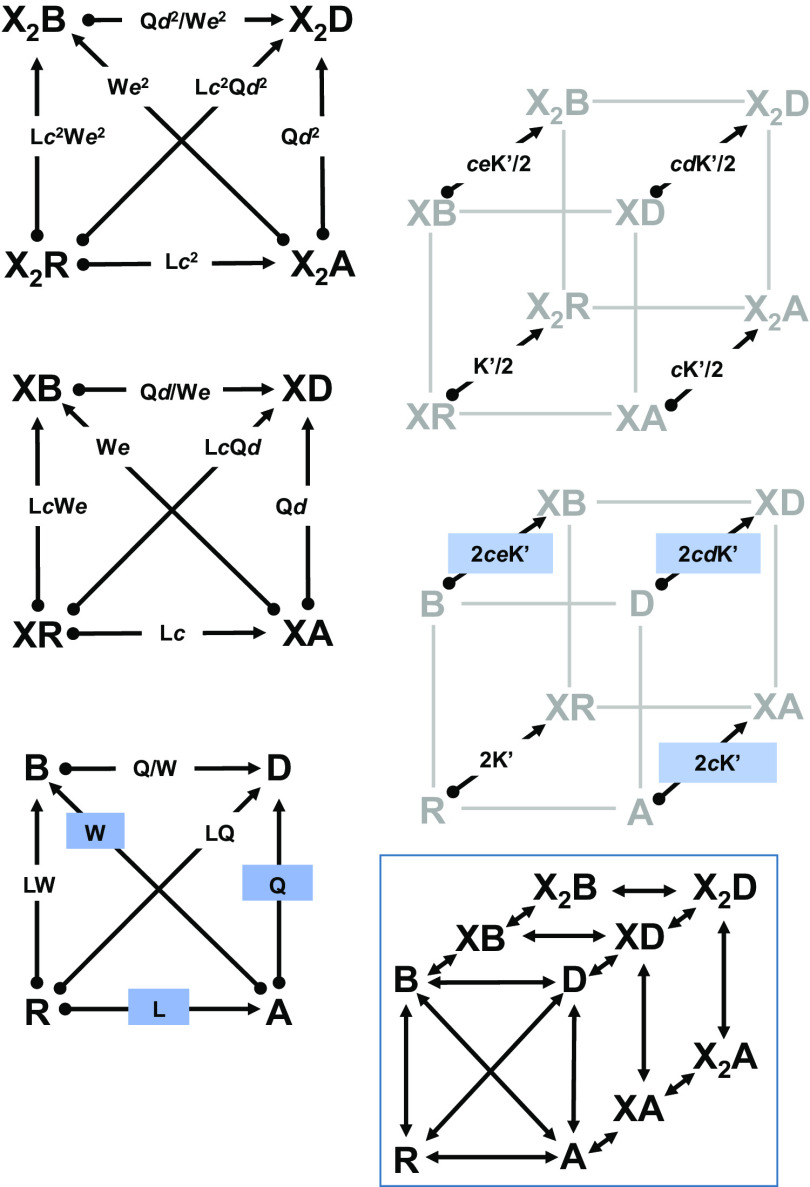
Fig. 1.
The RADB model. The figure shows the kinetic scheme for the RADB model: a concerted transition, 4-state cyclic scheme with one active state. There are 2 identical sites for binding a hypothetical drug ×. Due to the difficulty of seeing the individual transition between states, the scheme is broken into 5 subschemes: three for the paths between states with the same number of bound molecules of X and two for the binding steps between degrees of ligation. The arrows indicate the numerator and denominator of the ratio: the start state (numerator) is at the circle and the end (denominator) is at arrow head. The constants give the ratio of the probability of being in the starting state to that of the ending state, so X2R/X2A = Lc2 and X2A/XA = 1/(cK/(2[X])). In the figure, the ratio K/[X] is given as K’. The highlighted ratios indicate the basic parameters of the scheme: L = R/A, Q = A/D, W = A/B, c = KX,A/KX,R, d = KX,D/KX,A, and e = KX,E/KX,A. Detailed balance sets the requirement that two paths leading between the same two states must result in the same overall ratios. The boxed scheme shows the full three-dimenstional kinetic scheme without equilibrium ratios.

