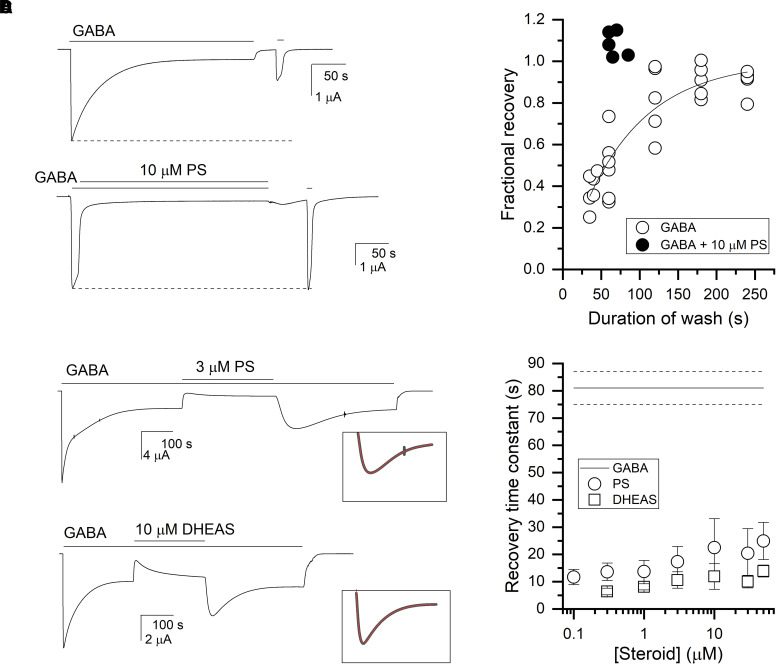
Fig. 3.
Recovery from transmitter-induced desensitization and PS-induced inhibition. (A) The α1β3γ2L receptors were exposed to 1 mM GABA alone (top trace) or to a brief application of 1 mM GABA followed by a coapplication of GABA + 10 µM PS (bottom trace) for ∼5 minutes. This was followed by a 30- to 50-second washout in bath, and a test application of 1 mM GABA. (B) The graph shows fractional recovery from GABA-induced desensitization (open circles) or PS-induced inhibition. Fractional recovery was calculated as the ratio of peak responses to 1 mM GABA after and before prolonged exposure to GABA or GABA + PS, with appropriate subtraction of the steady-state current. The line is the predicted curve generated by the best-fitting exponential (81 ± 6 seconds) to the data. (C) The receptors were exposed to 1 mM GABA, followed by a coapplication of GABA + 3 µM PS (top) or GABA + 10 µM DHEAS (bottom), and subsequent return to GABA alone. The time courses of current response upon switch from GABA + steroid to GABA alone were fitted to sums of two exponentials (inset). For the trace in PS, the time constants were: 29 seconds (recovery) and 118 seconds (decay), whereas in DHEAS, the time constants were: 14 seconds and 29 seconds. (D) The graph compares recovery from steroid-induced inhibition and GABA-induced desensitization. The data points give mean ±S.D. from 5–8 cells per condition for recovery from PS- or DHEAS-induced inhibition at various steroid concentrations. The lines indicate mean (solid) ±S.D. (dashed) for recovery from GABA-induced desensitization from the fit shown in panel B.

