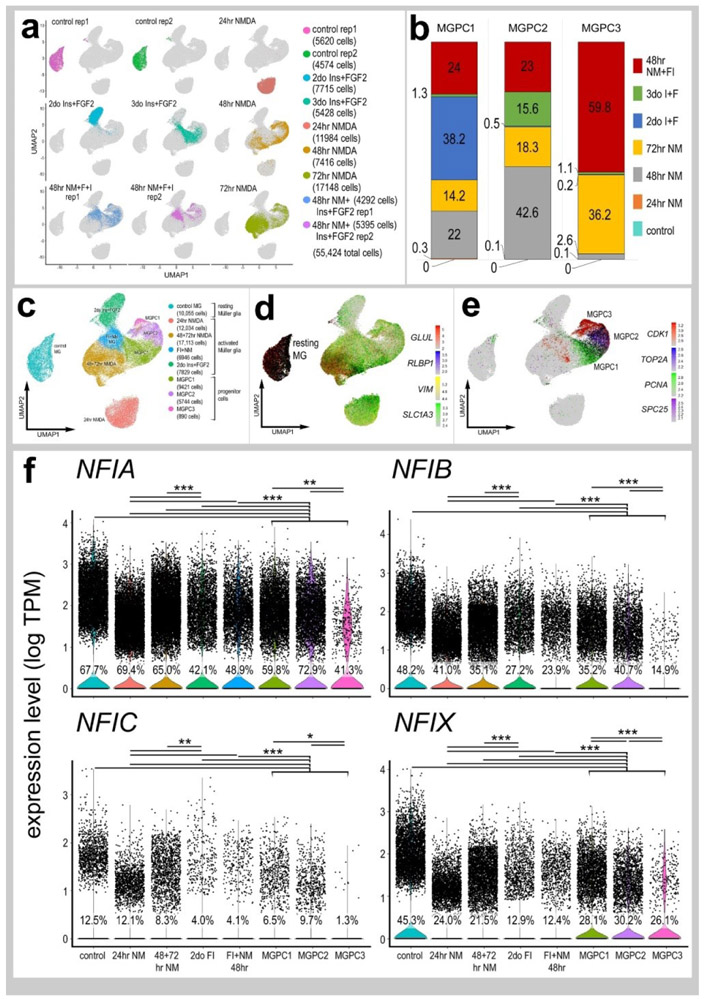
Figure 6. Comparison of NFI expression levels in Müller glia and MGPCs from different treatment conditions.
scRNA-seq was used to identify patterns of expression of NFIs in MG and MGPCs at different time points after NMDA damage and/or FGF + insulin growth factor treatment. Nine different libraries were aggregated for a total of more than 55,000 MG and MGPCs (a,c). MGPCs were identified based on high-levels of expression of CDK1, TOP2A, PCNA and SPC25 (c,e), and were a mix of cells from 48hrs NMDA+FGF2+insulin, 48hrs NMDA, 72hrs NMDA and 3doses of insulin+FGF2 (b). Resting MG were identified based on expression of GLUL, RLBP1, SLC1A3 and VIM (c,d). Each dot represents one cell and black dots indicate cells with 2 or more genes expressed. The expression of NFIA, NFIB, NFIC and NFIX is illustrated violin plots with population percentages and statistical comparisons (f). Significance of difference (*p<0.01, **p<10−10, ***p<10−20) in expression levels (log TPM) were determined by using a Wilcox rank sum with Bonferoni correction. Abbreviations: ONL – outer nuclear layer, INL – inner nuclear layer, IPL – inner plexiform layer, GCL – ganglion cell layer.

